2D Overview
Kendrick Labs, Inc. is a Contract Research Organization specializing in protein analysis using 1D and 2D SDS PAGE for Pharma/Biotech, Academia, Food/Nutrition and others.
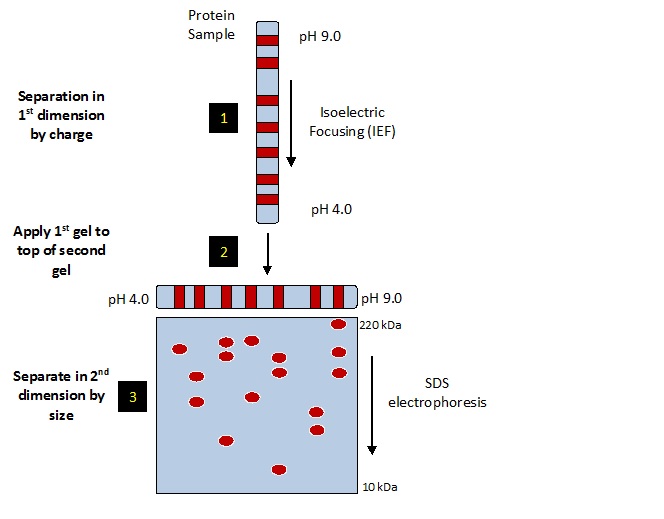
2-dimensional electrophoresis (2DE) is a biochemical method for separating complex mixtures of proteins into individual species. Proteins are first separated by charge using isoelectric focusing (IEF), then by size using sodium dodecyl sulfate (SDS) slab gel electrophoresis. The starburst pattern of protein spots is visualized on the final 2D slab gel by staining or western blotting. Proteins of interest may be identified by mass spectrometry.
Two variations of 2DE are currently in use world-wide that differ in IEF protocol. 1) The classic method of IEF, depicted in the image below and used at Kendrick Labs, utilizes carrier ampholines polymerized in acrylamide tube gels to generate the pH gradient. A nonionic detergent added to the mix imparts SDS compatibility so the method is called 2D SDS PAGE. 2) IPG-2DE is used at the majority of core labs. In this method the IEF pH gradient is immobilized on commercially available easy-to-use solid supports called IPG strips. Unfortunately, the strips are incompatible with SDS so sample preparation is often problematic. For more details comparing these two methods see whitepaper (PDF).
2D SDS PAGE (carrier ampholine 2D) is compatible with SDS, the best reagent by far for solubilizing proteins [5]. The method, originally developed by O’Farrell [1], discovered to have SDS compatibility by the Andersons [2], and refined at Kendrick Labs [3, 4]. Acrylamide tube gels are polymerized with carrier ampholines that form a pH gradient when voltage is applied and during IEF the ampholines and proteins migrate to a steady-state position. The 2D SDS PAGE method has been standardized at Kendrick Labs through written SOPs. SameSpots software allows exact pattern alignment before matching; computerized analysis of variable complex patterns has become straightforward. DIGE, while possible, is not necessary, and 2D SDS PAGE may be validated without it.
SDS compatibility with CA-2DE, first reported by Anderson et al [2], was later optimized at Kendrick Labs [3, 4]. Thus, samples be homogenized in SDS buffer, heated to 100 °C until the solution clarifies, then loaded without centrifugation. The resultant 2D SDS PAGE gels give quantitative results.
Evidence is presented on the following pages that CA-2DE is:
- Compatible with SDS
- A quantitative method for analysis of most proteins
- Extremely sensitive when used with Western blotting
SDS Compatibility
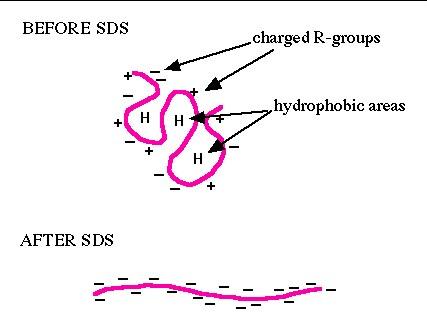
2D SDS PAGE is compatible with SDS because, although this detergent binds to proteins stoichiometrically, it comes off during IEF as shown in Figures 1-3.
 |
 |
|
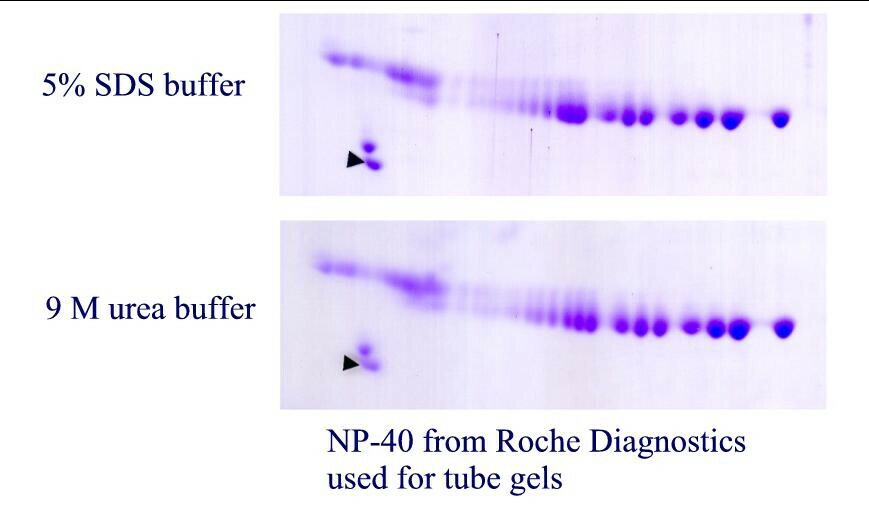
| Figure 1. SDS binding mechanism. When proteins are heated in the presence of SDS and ß-mercaptoethanol (BME), SDS binds to the peptide backbone and imparts a uniform charge/mass ratio. BME reduces disulfide bridges. All secondary and tertiary structure is lost. | Figure 2. Example: Carbamylated Creatine Phosphokinase Standard dissolved in either SDS (top) or 9M urea (bottom) buffer before IEF. The arrowhead marks the lower isoform of tropomyosin, pI marker of MW 33 kDa and pI 5.2. SDS does not interfere with IEF of this protein. |
How can negatively charged SDS be used to dissolve proteins prior to IEF where a single charge change is detectable? During CA-IEF, the SDS is stripped off proteins to make micelles with NP-40, a non-ionic detergent [3]. The charged micelles migrate to the acid end of the tube gel where they form a bulb that is discarded.
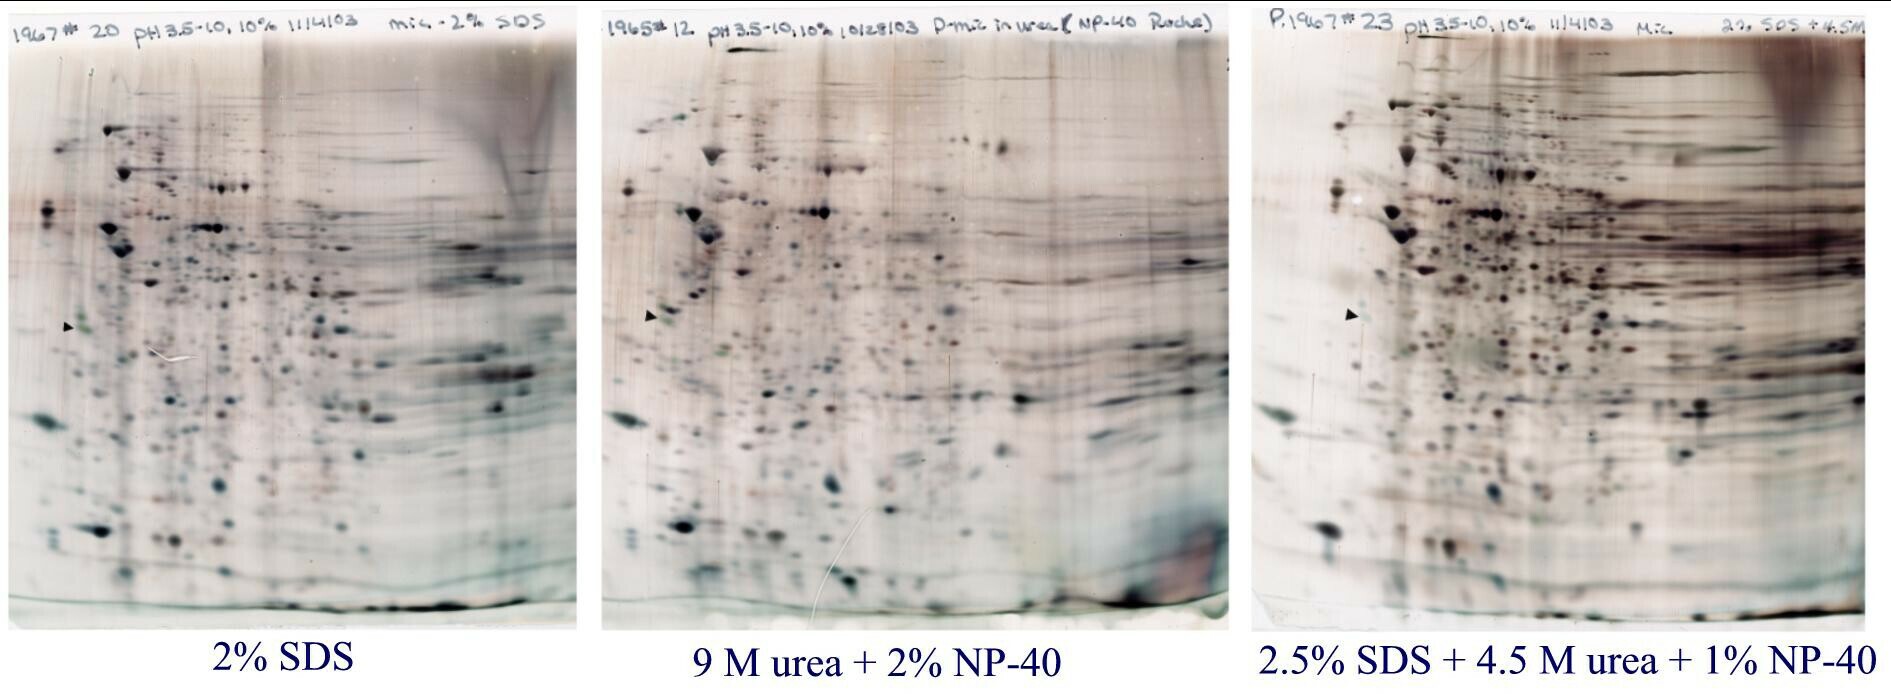
Figure 3. Rat liver microsomes prepared 3 ways. For this figure, microsomes (pellet obtained after homogenization, low speed spin and then 100,000 x g spin) were purchased and dissolved in either SDS buffer with heating (left) in urea buffer (middle), or SDS buffer with heating followed by dilution with urea buffer (right). Standard format (13 x15 cm) gels are shown loaded with 50 µg protein and silver stained. IEF was carried out with pH 3.5-10 ampholines. Microsomes prepared with SDS and urea, show a more complex pattern than the other two. TIP: Once sample preparation is optimized, don’t change it. Changing sample preparation may alter the pattern because of hidden salts and lipids that affect the pH gradient.
SDS versus Urea Examples
A. Purified CPK pI marker
Figure 4. Carbamylated creatine phosphokinase pI standard purchased from Amersham Biosciences and dissolved in either SDS (top) or 9M urea (bottom) before isoelectric focusing. The arrow marks the lower MW isoform of tropomyosin, our internal marker of MW 33,000 and pI 5.2. For this purified protein, no differences are observed between the two buffers.
B. Rat Liver Cytosol
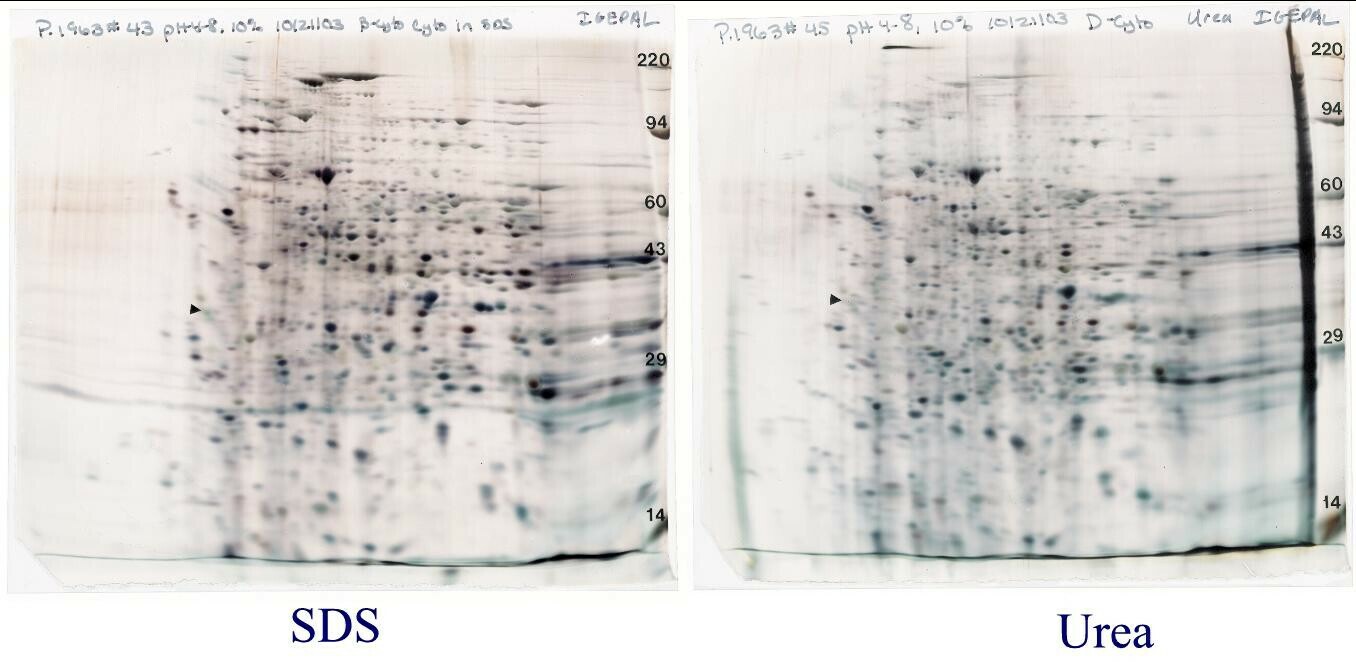
Figure 5. Rat Liver Cytosol. For this figure, rat liver cytosol (product of 100,000 x g spin) was purchased (CellzDirect/ ThermoFisher) and dissolved to 1 mg/ml in either our standard SDS buffer with heating (left) or urea buffer (right). In this case, the general 2D pattern is the same but several abundant proteins appear only in the SDS pattern, while one high MW protein only appears in the urea pattern. Proteins may shift positions in SDS buffer versus urea, but samples prepared the same will give a reproducible pattern from run to run.
C. E. coli whole cell preparation
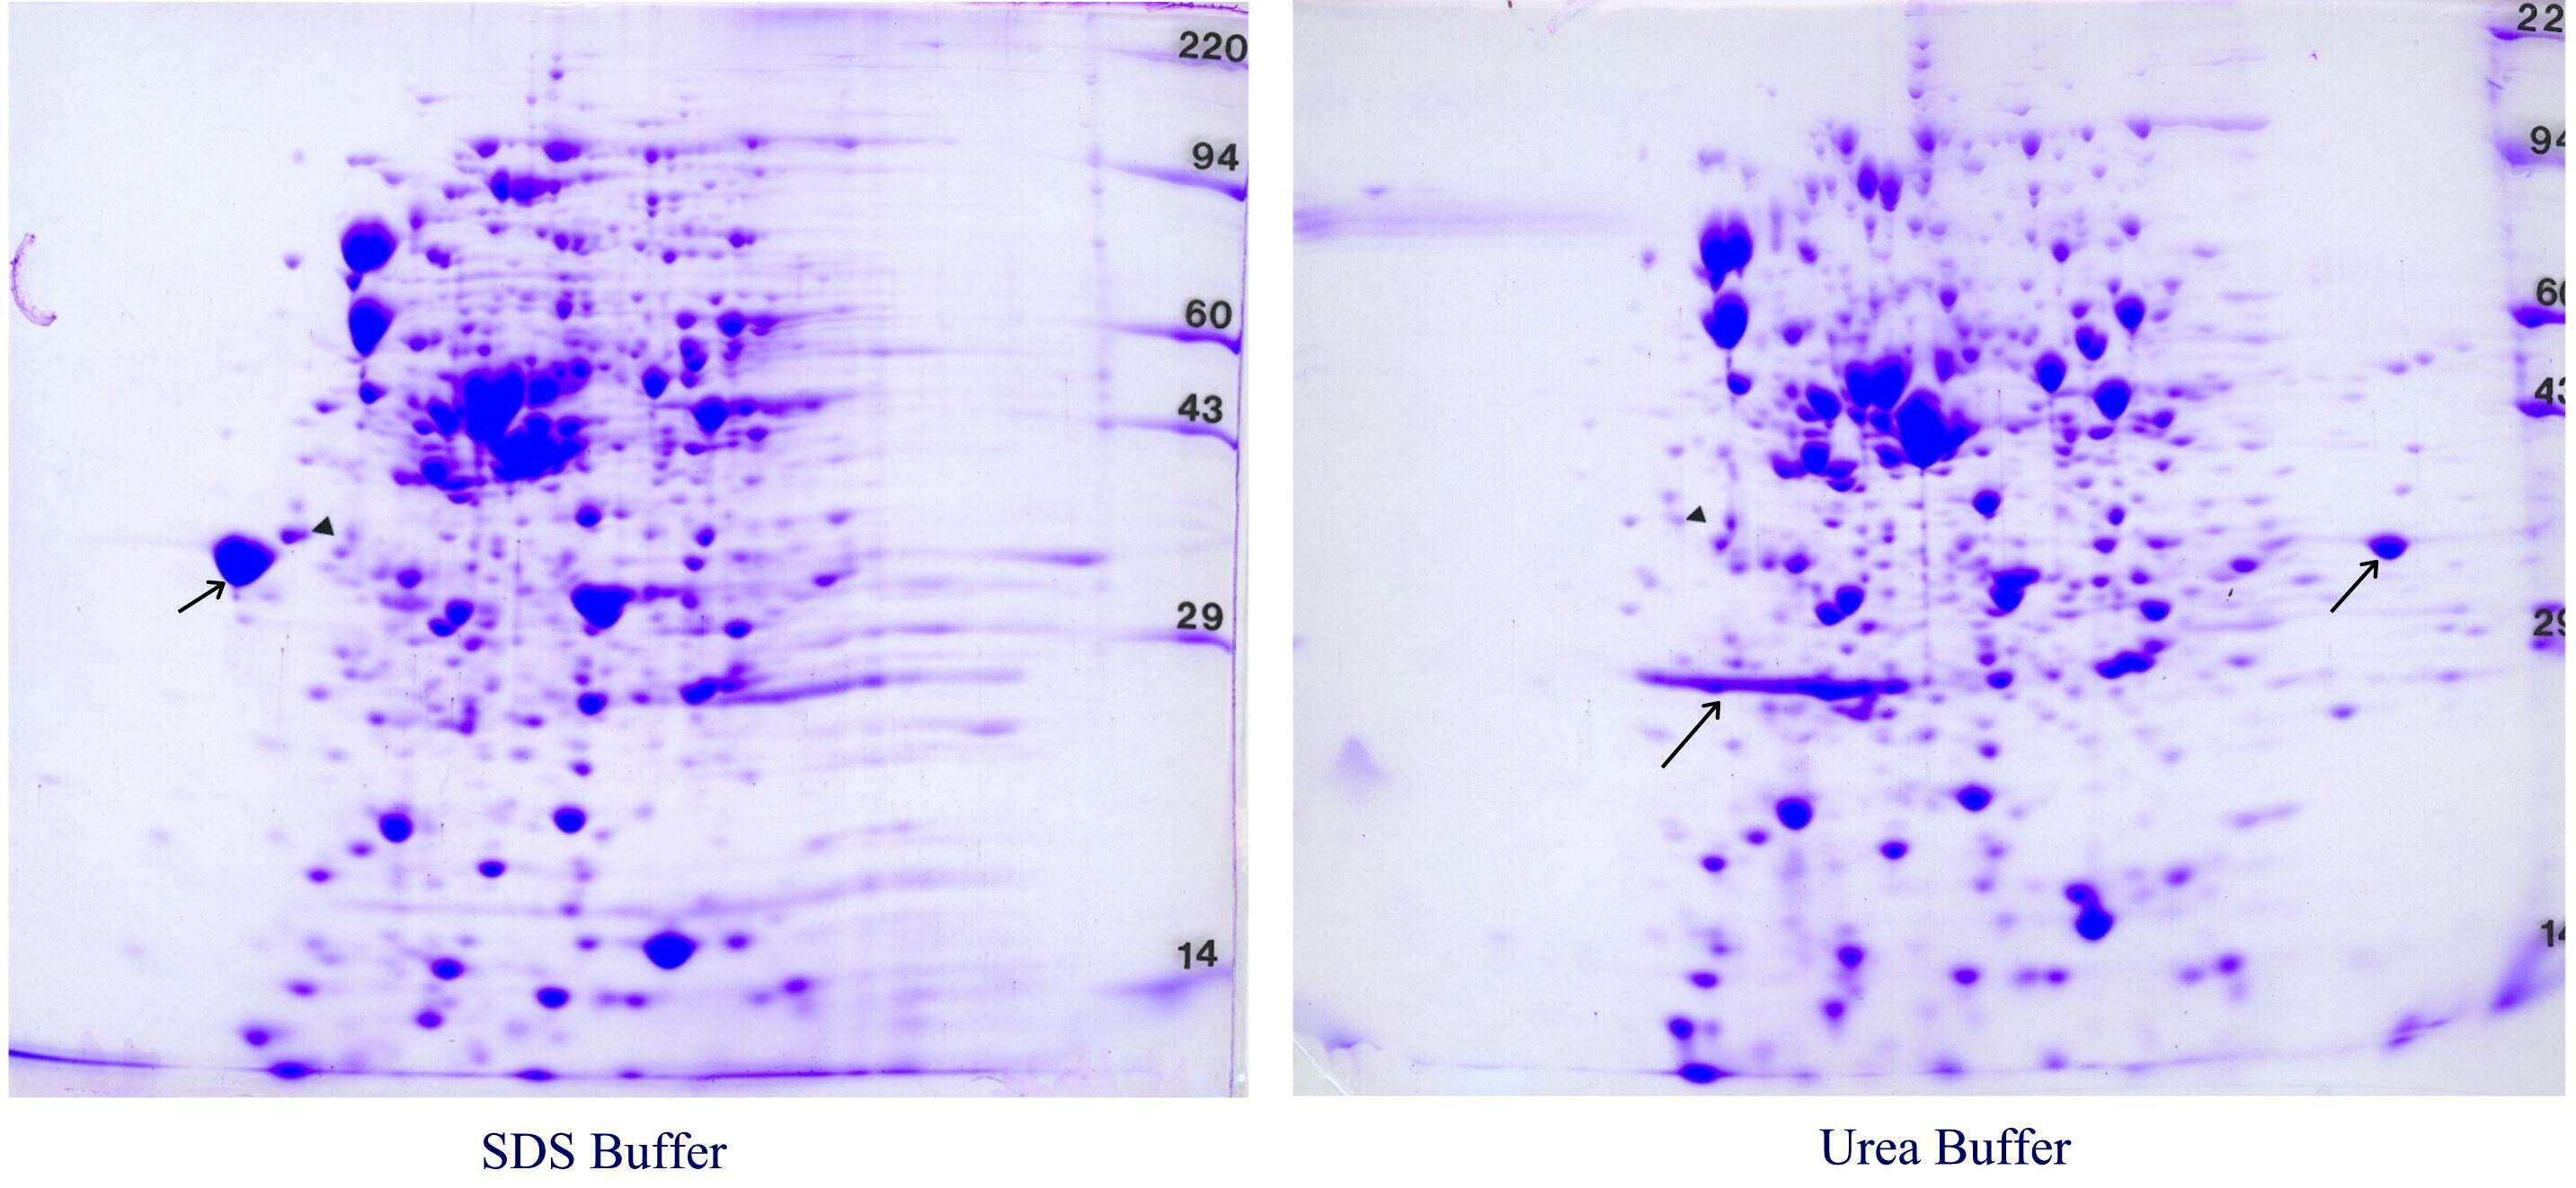
Figure 6. E. coli whole cell lysates. E. coli cells were pelleted, lysed and dissolved in either our standard SDS buffer with heating (left) or urea sample buffer (right). Again, the patterns are similar but a few abundant proteins are unique to each pattern (arrows).
D. CHO outer membranes
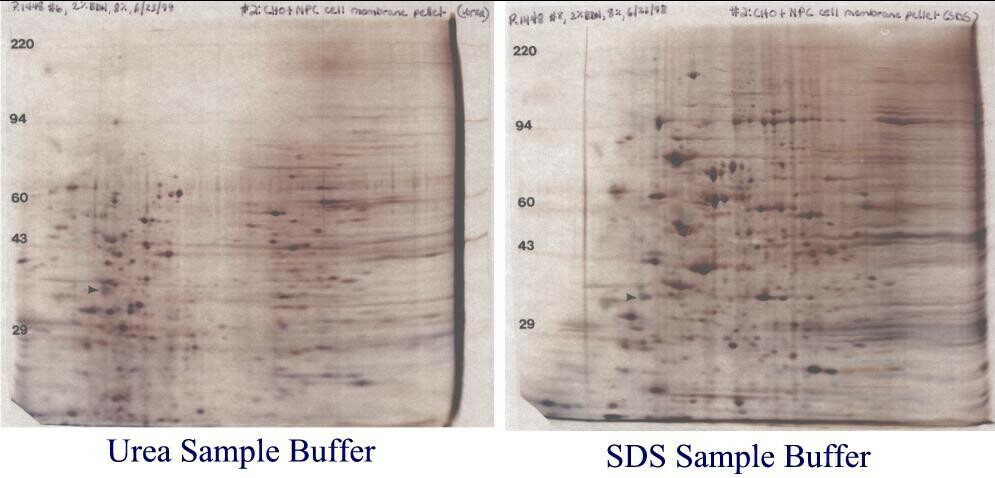
Figure 7. Chinese hamster ovary cell outer membrane samples. Identical outer membrane pellets were re-suspended in either our standard SDS buffer with heating (right) or urea sample buffer (left). Similar samples dissolved in urea buffer always showed the same bleached out central area in 2D gels. However, samples prepared in SDS always showed a nice, reproducible pattern. These gels are shown with with permission of Dr. Laura Liscum, Tufts University, Boston, MA who prepared the membrane samples.
So what’s going on? Membrane Composition affects the pattern. As shown in Table 1 (below), outer cell membranes are only about 50% protein and also contain about 40% lipid and 10% carbohydrates by weight. We think that for the CHO membrane samples prepared with urea, charged lipids are focusing during IEF and interfering with the pH gradient. However, for samples prepared with SDS, the charged lipids partition in the SDS/NP-40 micelles, travel to the extreme acid end of the tube gel and are discarded in the SDS bulb. In addition to improving solubilization of membrane proteins, for some samples SDS removes interfering substances through partitioning.
| Membranes | Protein | Lipid | Carbohydrate |
| Red blood cells | 49 | 43 | 8 |
| Liver cells | 54 | 36 | 10 |
| Amoeba | 54 | 42 | 4 |
| Myelin | 18 | 79 | 3 |
| Nuclear envelope | 66 | 32 | 2 |
| Endoplasmic reticulum | 62 | 27 | 10 |
| Golgi complex | 64 | 26 | 10 |
| Mitochondrion | |||
| Outer membrane | 55 | 45 | trace |
| Inner membrane | 78 | 22 | — |
Table 1. Membrane Composition. Amounts of protein, lipid and carbohydrate in different biological membranes (approximate percentage of dry weight). Reference “Lab Books Membrane Structure and Fluidity”.
2D Quantification
2D SDS PAGE with Coomassie blue staining is quantitative for most proteins.
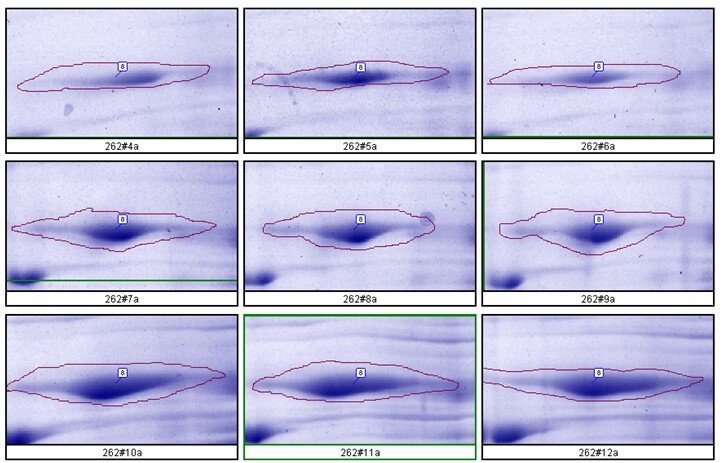
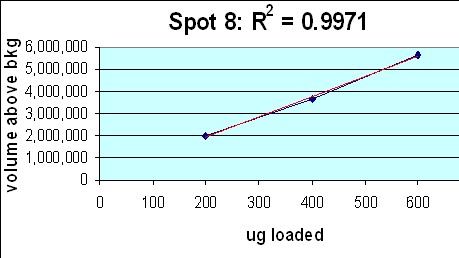
The relationship between spot density and total protein loaded is excellent; R2 = 0.9971.
Figure 8. Top: Montage showing spot outlines for 200 µg (upper 3 panels), 400 µg (middle 3) and 600 µg (bottom 3) total protein loaded for polypeptide spot 8 of MW 76,100, pI 8.1. Bottom: Plot of protein spot integrated density above background versus total protein loaded (200 µg, 400 µg and 600 µg) for the same spot.
Experimental Procedure
- Rat liver cytosol was diluted with buffer containing 2.5% SDS + 4.5 M urea before running on large format 2D gels in triplicate at loads of 200, 400 and 600 µg. Kendrick Labs standard operating procedures were used for all steps. The gels were Coomassie blue-stained and scanned with a laser densitometer calibrated to be linear over 0-3 OD. Sixty polypeptide spots were quantified with Progenesis software from Nonlinear Dynamics.
For additional details regarding quantification see our validation powerpoint and publication.
2D Western Blotting
2D SDS PAGE Western blotting has high sensitivity and specificity.
Proteins in a sample are resolved by 1D or 2D electrophoresis and then, at Kendrick Labs, transferred to a PVDF membrane. After transblotting, the PVDF is stained with Coomassie blue and scanned to record the general 2D pattern. The stain washes off during subsequent incubations with blocking agent and primary antibody; it does not interfere. Protein dissociation constants for antibody-antigen binding range from 10-8 to 10-12, this extraordinarily tight binding of antibodies to an antigenic determinant (epitope) is useful for protein detection [5]. Finally the membrane is incubated with a secondary antibody that illuminates in the presence of a chemical called ECL followed by exposure to x-ray film. (Film development is faster and more efficient than chemiluminescent scanning when Western blots are run in large sets.) The film patterns are superimposable with the image of the stained blot. Matching from the film to the blot image and from there to a stained duplicate gel for spot cutting allows straightforward protein identification by mass spectrometry.
2D SDS PAGE with Western blotting has many purposes. For example, it is useful for tracking protein purification via immunoprecipitation, for finding proteins with post-translational modifications such as lysine acetylation, and for determining if low abundance proteins are present in a tissue. High affinity antibody binding gives high sensitivity for the antigen.
Receptor Tyrosine Kinase Western blotting: The example shown below are a 2D SDS PAGE Western blots obtained using a phosphotyrosine antibody against whole cell lysate of a human lung cancer tumor sample and matched control. A glycosylated ~200 kDa protein is lighting up in the cancer sample, at about the molecular weight of a receptor tyrosine kinase (red arrow). No signal in that area was seen for normal tissue taken from the same lung. 2D SDS PAGE Western blotting of the cancer sample with an antibody against epidermal growth factor receptor (EGFR) showed a signal that co-migrated with the phosphotyrosine spot suggesting the protein is EGFR. However, three attempts to confirm the identity by spot cutting and mass spectrometry (LC/MS/MS) have failed. Usually protein spots cut from Kendrick Labs 2D gels may be identified by MS. But in this case, phosphotyrosine Western blotting gives a clear signal that is much more sensitive than mass spectrometry.
Figure 9. These films, obtained with a phosphotyrosine antibody, demonstrate the remarkable sensitivity of 2D SDS PAGE Western blotting. Right: Phosphotyrosine (pTyr) Western blot of whole cell lysate from a human lung tumor sample prepared with SDS buffer. The arrow marks a putative receptor tyrosine kinase, probably Epidermal Growth Factor Receptor, known to be a driver of lung cancer. Left: corresponding pTyr WB from matched normal lung tissue from the same patient. Conditions: standard format 2D gel (13 x 15 cm), 200 µg protein load, PY20 pTyr antibody with overnight incubation. Binding to the heavily loaded MW markers on the right allows matching between lots. Two of the marker proteins, phosphorylase A, 94 kDa, and carbonic anhydrase, 29 kDa, are sold by CalBiochem as pTyr MW markers. The protein marked by the red arrow co-migrated with the protein highlighted by EGFR Western blotting on a replicate blot (not shown).
Membrane Proteins in SDS
Sample preparation is everything for successful 2D electrophoresis of membrane proteins.
Effective sample preparation of membrane proteins consists of 2 parts: 1- Preparing the membranes and 2- Dissolving them in a 2D buffer.
1-Preparing membranes:
The final purity of the membrane fraction depends on the protocol used and also on morphology of the starting cells. Morphology can vary widely . The book “Subcellular Fractionation” by J. Graham and D. Rickwood, Oxford University Press, 2002 edition, is a good place to start for membrane preparation protocols if you don’t have a specific reference for your cells or tissue.
2- Dissolve the prepared membrane proteins in SDS buffer.
The carrier ampholine IEF system used at Kendrick Labs is compatible with SDS (sodium dodecyl sulfate, CH3(CH2)11OSO3Na), and we favor this detergent for dissolving protein samples. When proteins are heated in the presence of SDS and B-mercaptoethanol (BME), SDS binds to the peptide backbone and imparts a uniform charge/mass ratio, as depicted in the schematic below. BME reduces disulfide bridges. All secondary, tertiary and quaternary structure is lost.
For tube gels at KLabs: SDS buffer minus BME is added to the sample, and then it is heated in a boiling water bath until the solution clarifies (2-5 min). Then a protein determination is performed using the BCA method, followed by the addition of BME and sometimes urea before loading for IEF. Note that for IPG strips, samples are diluted with urea/thiourea + CHAPS buffer at the onset and can’t be hea
How can negatively charged SDS be used to dissolve proteins prior to isoelectric focusing where a single charge change can be detected? Leigh and Norman Anderson [2] showed that during tube gel IEF, SDS is stripped off the proteins to make micelles with NP-40, a non-ionic detergent. The micelles are highly charged and migrate to the acid end of the tube gels where they form a bulb that is discarded.
Examples of Membrane Samples Prepared with SDS
Fusobacteria outer membranes
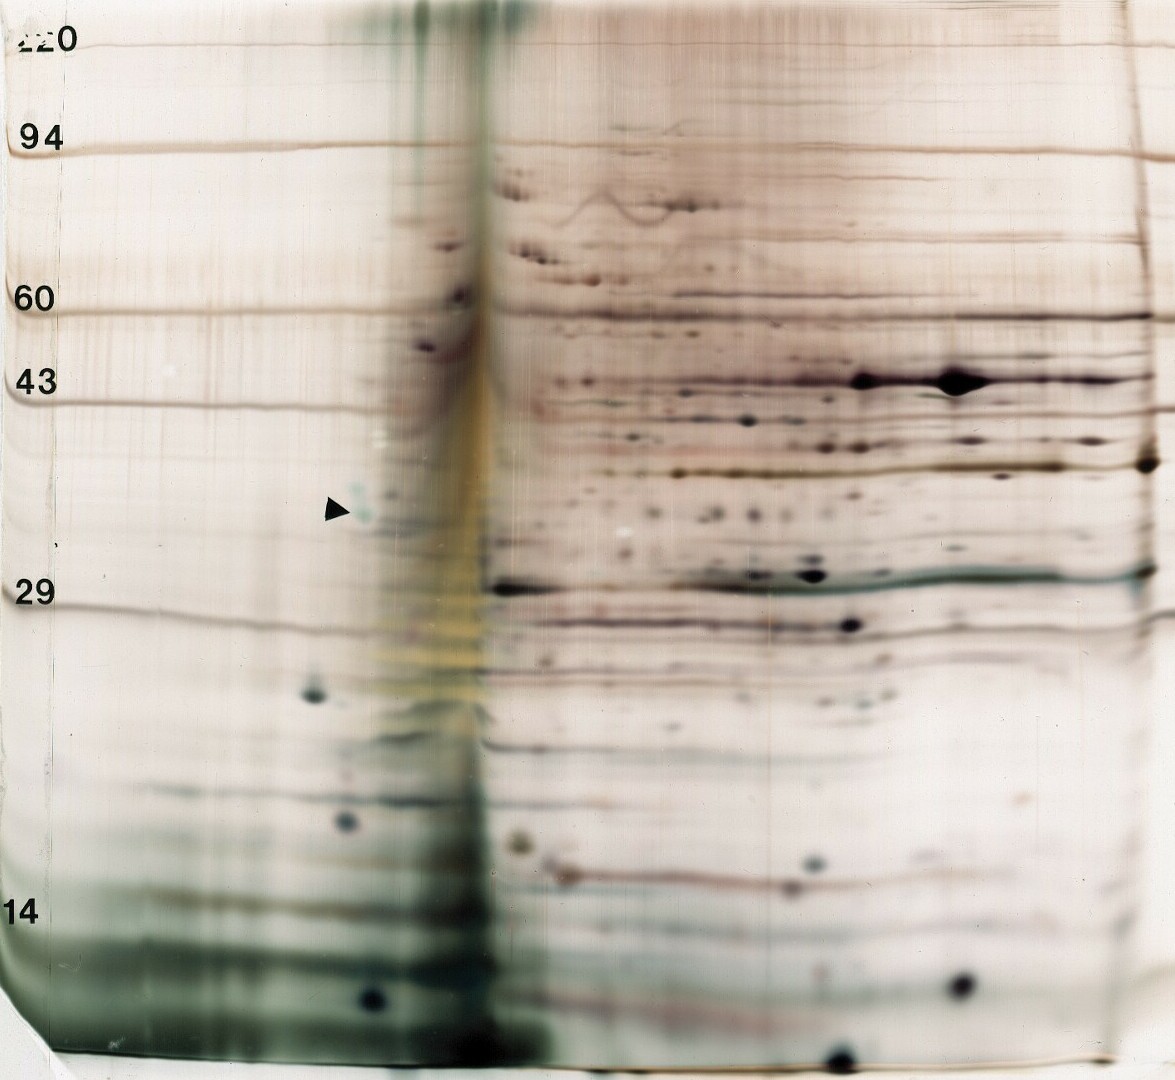
Figure 10. Fusobacterium outer membranes. This sample is from a gram negative anaerobic bacteria found in ental plaque, a common pathogen in anaerobic abscesses. Some sort of complex glycolipid co-purifies with the cell membrane and interferes with IEF. With permission of Dr. Susan Haake, UCLA School of Dentistry. Conditions: standard size gel, pH 4-8 ampholines, 10% acrylamide, silver stain. For this older gel the MW markers appear as lines across the gel, not as bands on the side.
Red blood cell ghosts
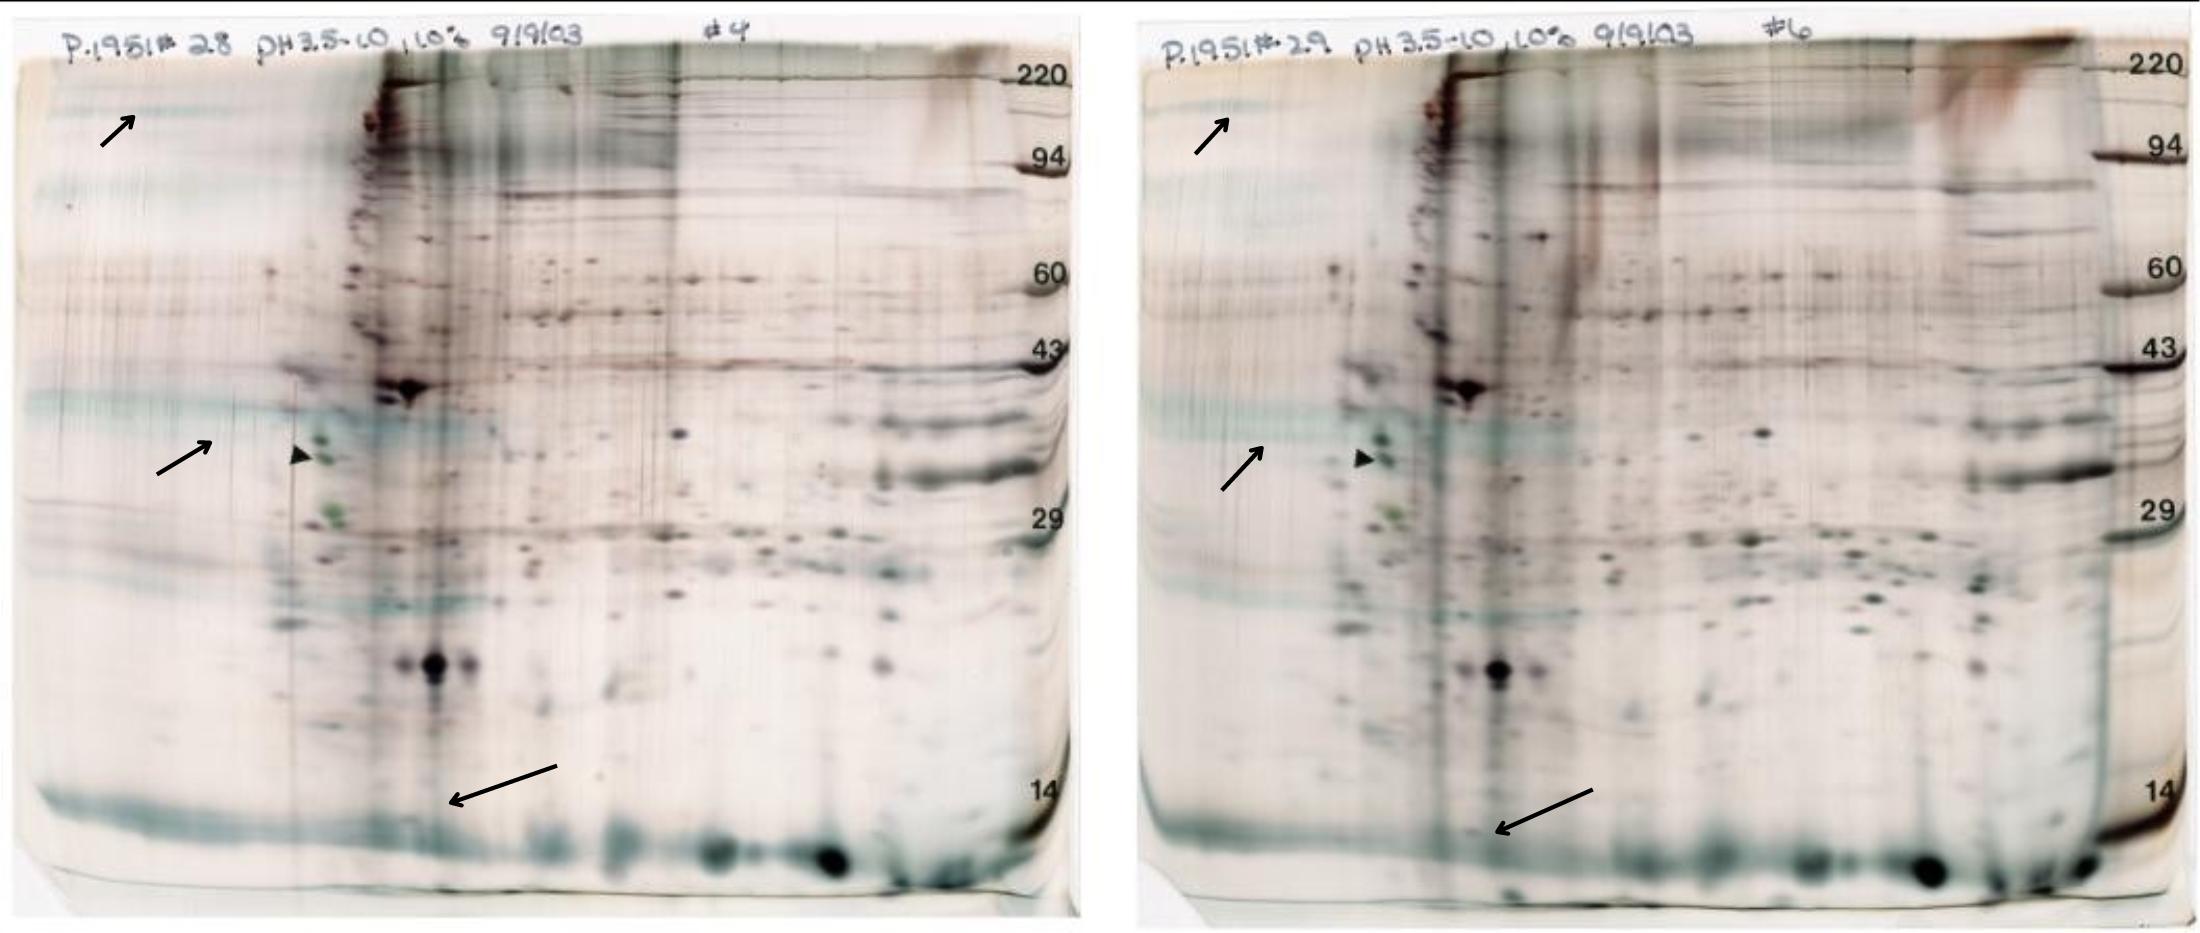
Figure 11. Red Blood Cell membranes. RBC ghosts are 49% protein, 43% lipid and 8% carbohydrate by weight. Note that many membrane proteins are glycosylated and aren’t discrete spots because of microheterogeneity in the sugar groups. Duplicate gels are presented to show reproducibility; arrows mark reproducibly streaky proteins. Shown with permission of Dr. Asok Chaudhuri, New York Blood Center, Cell Biology Dept. Conditions: standard size gel, pH 3.5-10 ampholines, 10% acrylamide, silver stain.
Mouse brain synaptosomes
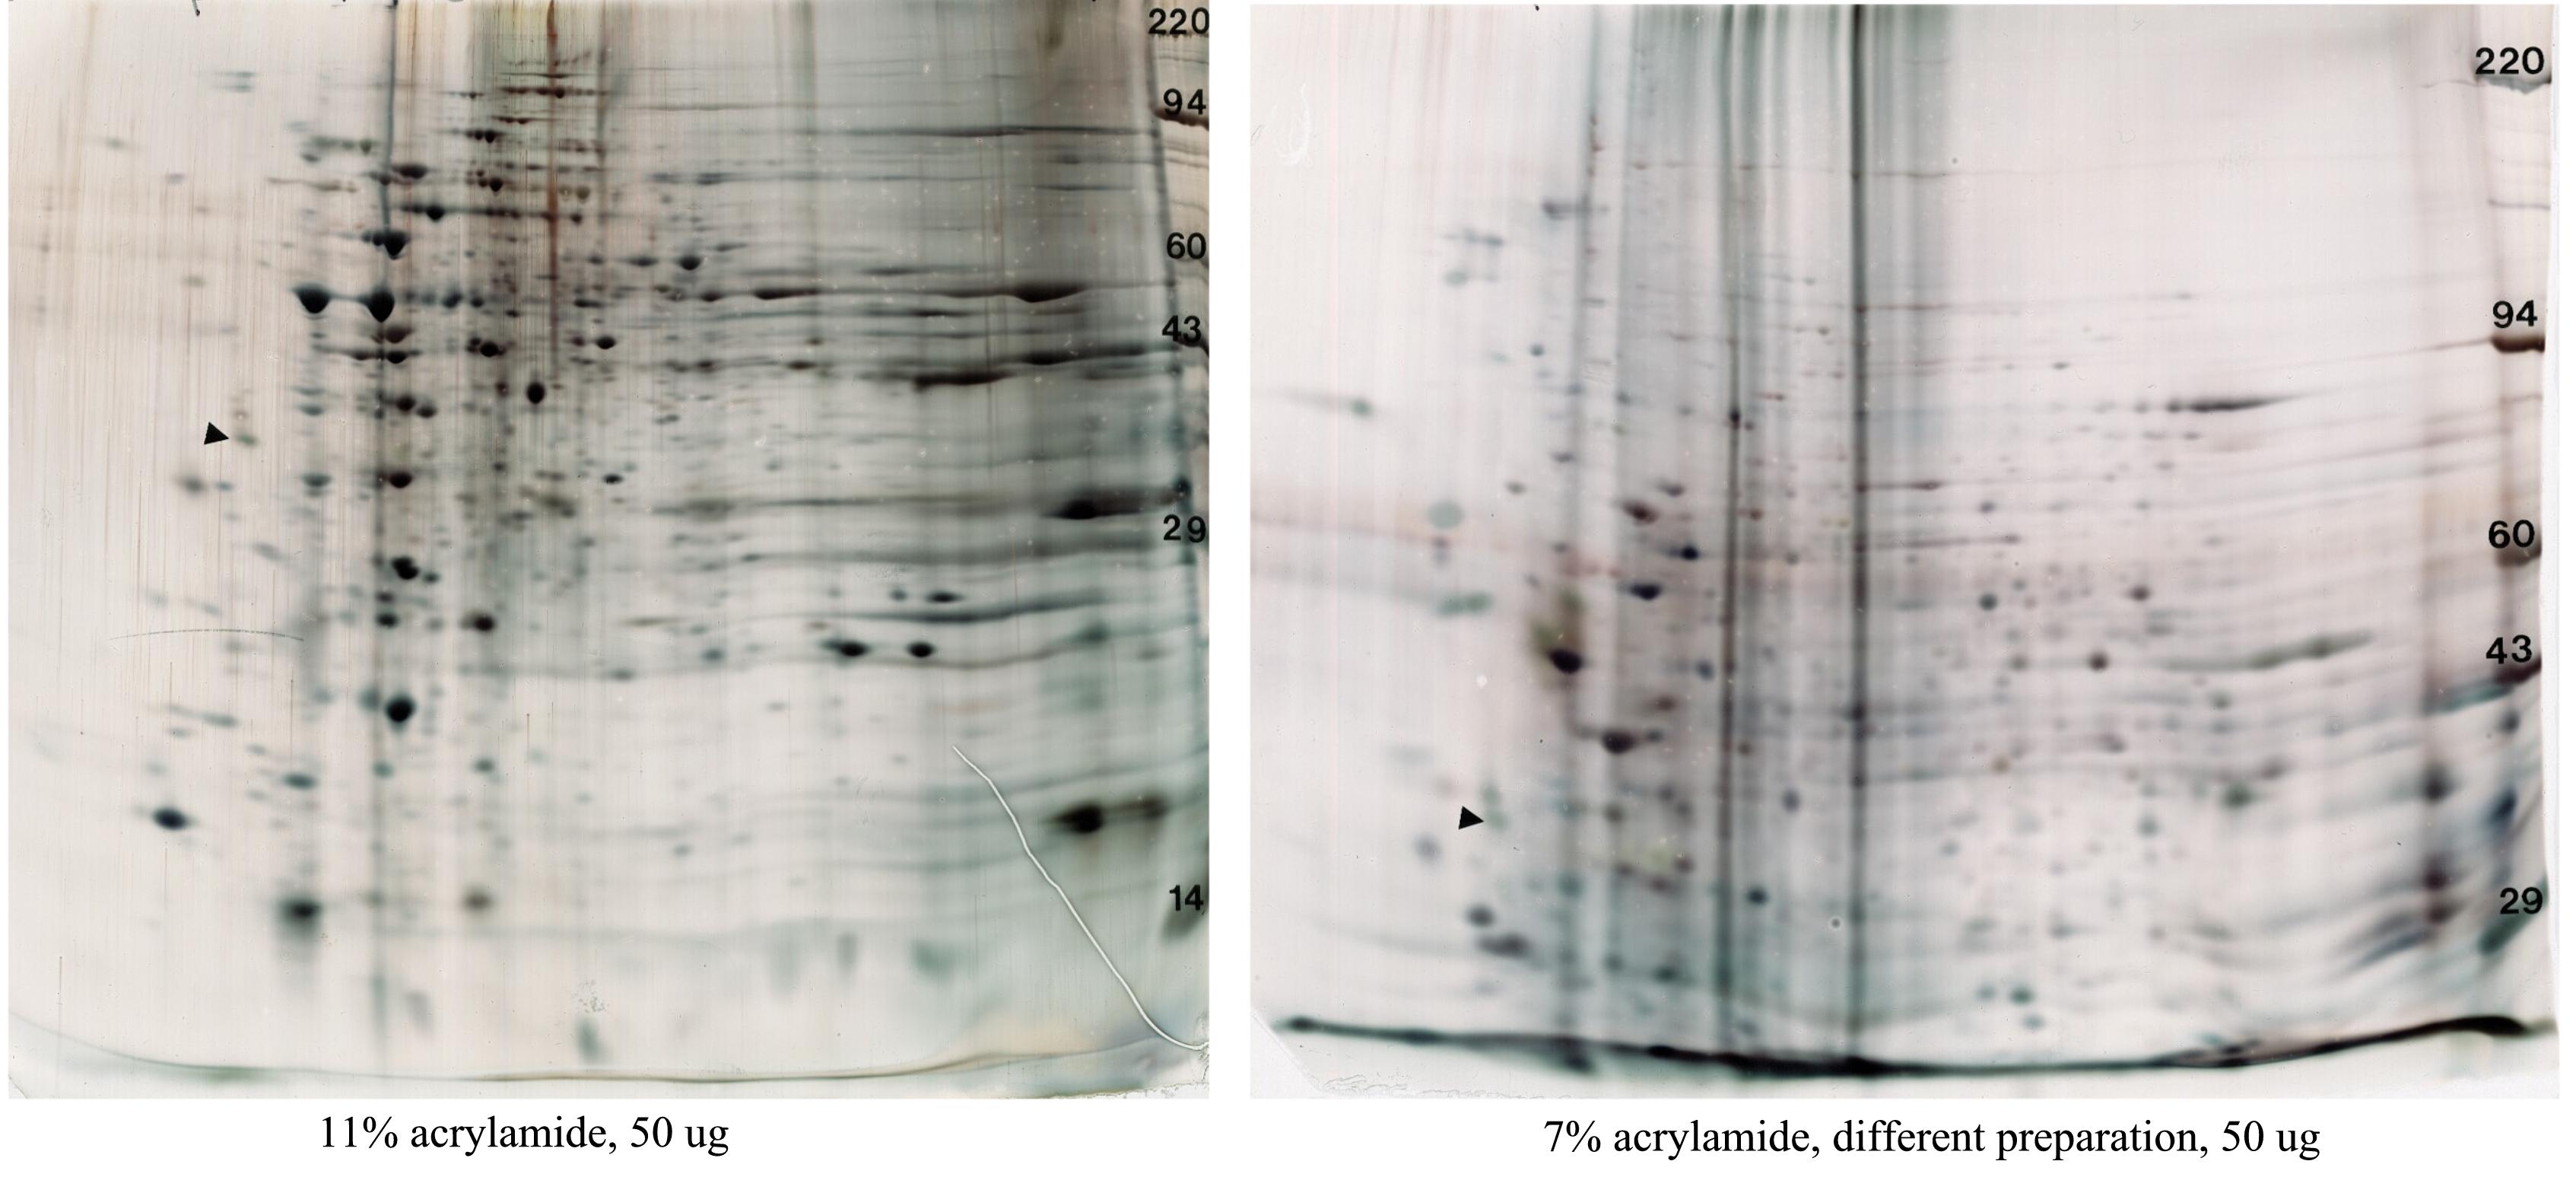
Figure 12. Mouse brain synaptosomes (nerve ending particles). Two different preparations are shown on two different percentages of acrylamide for the 2nd dimension gel, 11% (left) to resolve intermediate MW proteins and 7% (right) to resolve high MW species. More interfering substances are present in the sample on the right. These gels are shown with permission of Dr. Christopher Ellis, National Institute of Health. Conditions: standard size gel, pH 3.5-10 ampholines, 10% acrylamide, silver stain.
Hepatocyte inner membranes
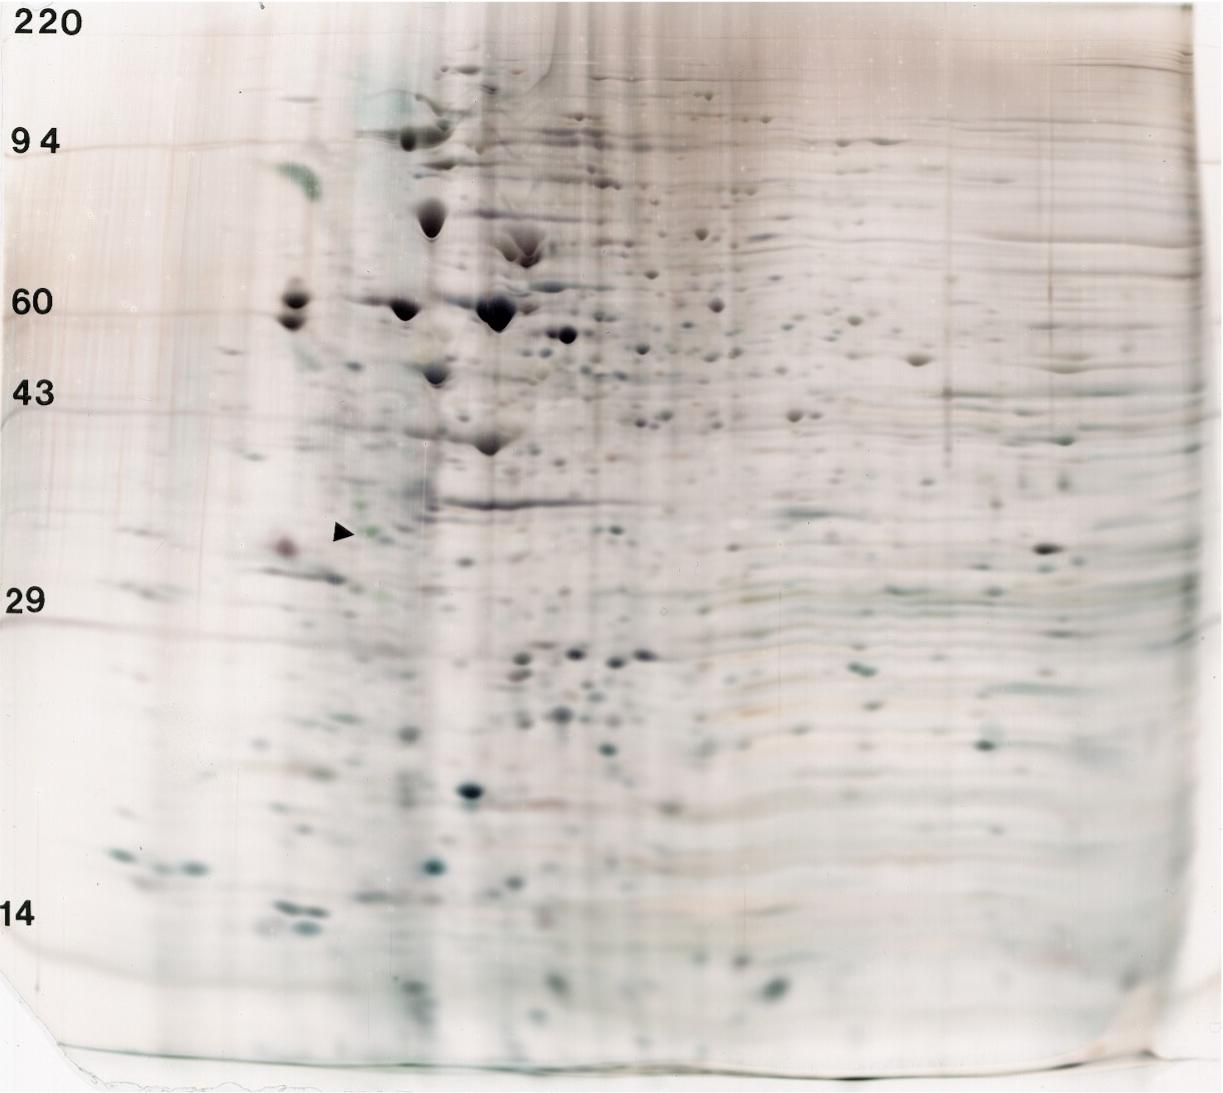
Figure 13. Human hepatocyte inner membranes. The membrane fraction was obtained by homogenization, differential centrifugation and an end step of sucrose density gradient fractionation. The final fraction was dialyzed against 20 mM tris HCl pH 8, 50 mM NaCl, 5 mM EDTA and 5% glycerol before shipping. At Kendrick Labs the sample was redissolved to 1 mg/ml in SDS buffer and heated in a boiling water bath for 5 min before loading 50 µg. Conditions: standard size gel, pH 3.5-10 ampholines, 10% acrylamide, silver stain.
Examples SDS + Urea
Example of membrane sample prepared with SDS followed by addition of 4.5 M Urea.
Rat liver microsomes
Figure 14. Rat liver microsomes prepared 3 ways. For this figure, rat liver microsomes (pellet obtained after homogenization, low speed spin and then 100,000 x g spin) were purchased (CellzDirect/ThermoFisher) and dissolved to 1 mg/ml in either our standard SDS buffer with heating (left), in standard urea buffer (middle), or SDS buffer with heating followed by urea buffer (right). Standard size gels, pH 3.5-10 ampholines, 10% acrylamide, silver stain.
The 2D gel on the right, from microsomes prepared with SDS and urea, is significantly better than the gels from either buffer alone.
References
References
1. O’Farrell, P.H., High resolution 2-dimensional electrophoresis of proteins. J Biol Chem, 1975. 250: p. 4007-21.
2. Anderson, L. and N.G. Anderson, High resolution two-dimensional electrophoresis of human plasma proteins. Proc Natl Acad Sci U S A, 1977. 74(12): p. 5421-5.
3. Burgess-Cassler, A., J.J. Johansen, D.A. Santek, J.R. Ide, and N.C. Kendrick, Computerized quantitative analysis of coomassie-blue-stained serum proteins separated by two-dimensional electrophoresis. Clin Chem, 1989. 35(12): p. 2297-304.
4. Kendrick, N., C.C. Darie, M. Hoelter, G. Powers, and J. Johansen. 2D SDS PAGE in Combination with Western Blotting and Mass Spectrometry is a Robust Method for Protein Analysis with Many Applications. Advances in Experimental Medicine and Biology. 2019. 1140: p.563-574.
5. Lehninger, A.L., D.L. Nelson, and M.M. Cox, Lehninger Principles of Biochemistry. 5th ed. 2008, New York: W.H. Freeman.
Kendrick Labs offers protein analysis services.
For questions or to discuss your project, contact one of our experts below without obligation. Confidentiality is guaranteed. Just call 800-462-3417 or e-mail Jon (Lab Manager) or Matt Hoelter (WB Manager).
