Overview
Product Characterization Overview
Kendrick Labs focuses on three different methods to help you characterize your drug substance or compare biosimilars as detailed on the following tabs. 2D SDS PAGE is useful for characterizing differences between biosimilars or for product stability studies. IEF gels can compare isoelectric points between two different lots of sample. 1D SDS PAGE can be used to test for product purity. Additional custom services are available. We offer a plethora of electrophoresis variations to help characterize your protein of interest.
2D SDS PAGE
2D SDS PAGE to Compare Complex Biologics
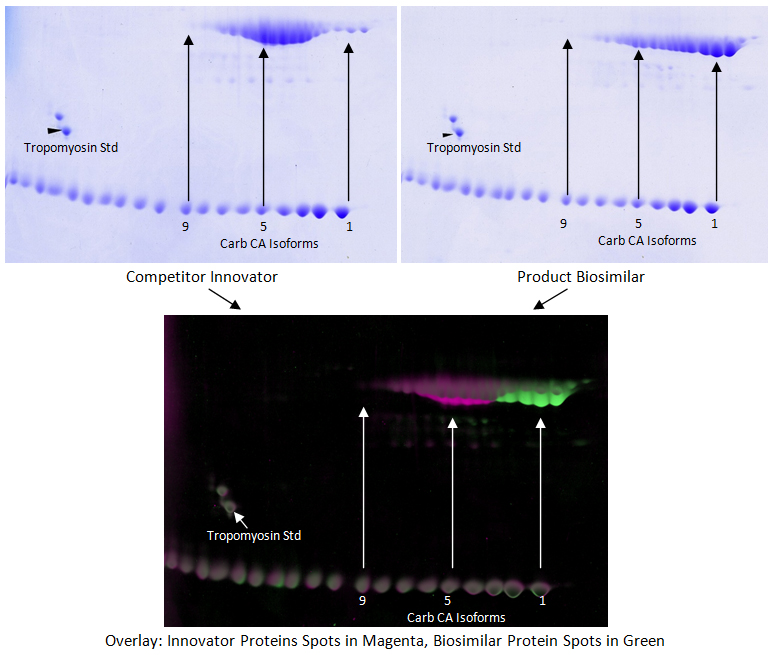
In 2D SDS PAGE, proteins are separated by isoelectric point in the first dimension using isoelectric focusing and by molecular weight using SDS PAGE in the second dimension. Kendrick Labs uses this method to characterize complex biologics. For example, protein patterns of a biosimilar drug product can be compared to an innovator drug product to show similarities and differences between the two products. Data can be used to help refine the manufacturing process or to demonstrate similarity of the two products for regulatory agencies.
In the above example, two different products were loaded on separate 2D gels and stained with Coomassie. The gels were scanned using a calibrated GE ImageScanner III, and the images analyzed using computer software. The software allows our experienced analysts to perfectly align the 2D gels and outline the spots. Carbamylated Carbonic Anhydrase and Tropomyosin IEF standards were loaded to aid in gel alignment. Spot data can be quantified, and differences between the two samples can be calculated to provide data about how isoforms are similar or different between the samples.
Isoelectric Focusing
Isoelectric Focusing to Compare Isoform Isoelectric Points
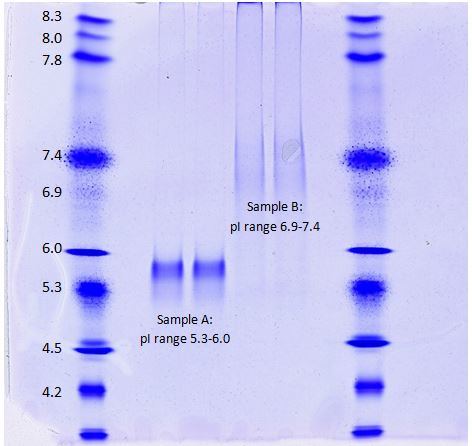
Post-translational modifications (PTM), such as phosphorylation, glycosylation, and acetylation, shift the isoelectric points (pI) of proteins. The proteins are first dissolved in a buffer that does not have an effect on the intrinsic charge of the protein. Samples are loaded on a special acrylamide gel containing ampholytes which establish a pH gradient along the length of the gel. Once an electric field is applied, the proteins in the sample migrate to the pH at which they no longer have a net charge and stop migrating in the electric field. Thus, the proteins are separated by pI, and any shifts in pI can easily be visualized using isoelectric focusing (IEF) in a single dimension. This method is especially useful when looking at purified protein products.
Kendrick Labs uses Invitrogen pH 3-10 IEF gels to perform isoelectric focusing of protein samples. Serva IEF standards are loaded alongside the samples to compare pH ranges of the isoforms. The gels can be used to see how PTMs alter the pI of a protein of interest. This method is useful to compare lot-to-lot variability for IgG samples, protein isoforms of innovator versus biosimilar products, and much more. In the above example, Sample A shows clear discrete bands ranging from a pI if 5.3-6.0, while Sample B shows a more diffuse pattern with a pI range from 6.9-7.4.
1D SDS PAGE
1D SDS PAGE to Check Product Purity
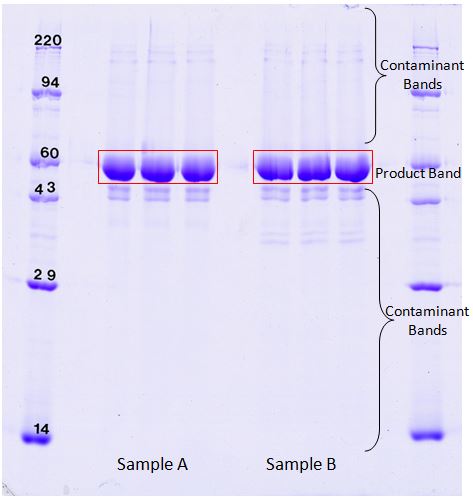
1D SDS PAGE separates proteins in a single dimension based on their molecular weight (MW). Protein samples are first dissolved in sodium dodecyl sulfate (SDS), which imparts a uniform negative charge to the protein, and are then loaded onto polyacrylamide gels. When an electric field is applied, the proteins sieve through the acrylamide gel matrix according to their size; larger proteins take more time to migrate through the pores in the gel matrix than smaller proteins, so higher MW proteins end up at the top of the gel, while lower MW proteins migrate to the bottom of the gel. Protein impurities can be visualized and quantified relative to the product of interest.
1D SDS PAGE gels are useful for checking protein products for impurities. Our highly quantifiable Coomassie blue stain can detect as little as 20 ng of protein. TotalLab 1D software is used to give a percent purity of the product based on Coomassie blue dye binding. In the above images, the product band comprised 87.2% of the total Coomassie stain density in sample A and 86.1% of the density in sample B. Follow the link to download an example report showing band percentage results using the samples A and B (shown above) SDS Purity Report (PDF).


