- Standard Format 2D Gel System: See Burgess-Cassler, A. et. al, “Computerized quantitative analysis of Coomassie-blue-stained serum proteins separated by 2D electrophoresis”. Clin Chem, 1989. 35(12): p. 2297-304. and Kendrick, N. et. al, “2D SDS PAGE in Combination with Western Blotting and Mass Spectrometry is a Robust Method for Protein Analysis with Many Applications”. Advances in Experimental Medicine and Biology. 2019. 1140: p.563-574. for data showing linearity and reproducibility of our standard format 2D gels.
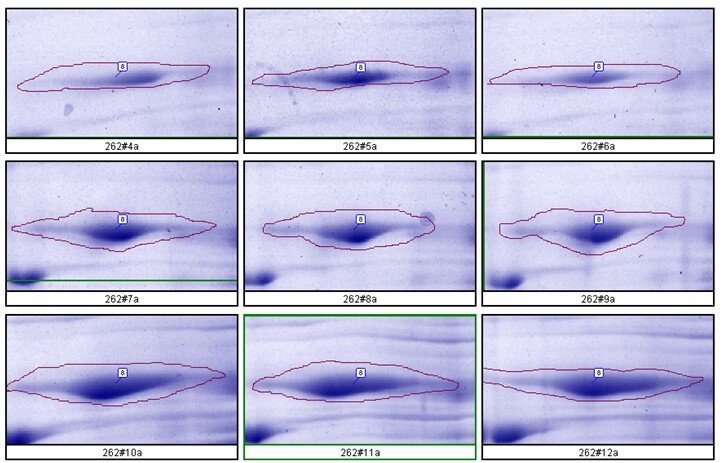
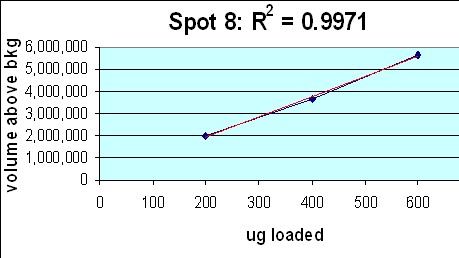
- Large Format 2D Gel System: Validation of our large format 2D gel system was performed in house. Rat liver cytosol was run on large format 2D gels in triplicate at loads of 200, 400 and 600 µg according to Kendrick Labs SOPs. The gels were Coomassie blue-stained according to standard procedures and scanned with a laser densitometer calibrated to be linear over 0-3 OD. Sixty polypeptide spots were outlined by hand with Progenesis/SameSpots software (TotalLab) on all the gels; the integrated density values were transferred to Excel. Figure 1 below shows the 9 spot outlines for one protein (spot 8, MW 76,100, pI 8.1) along with the Excel plot of spot density versus ug loaded. The relationship between spot density and total protein loaded is excellent; R2 = 0.9971.
Figure 1. Top: Montage showing spot outlines for 200 μg (upper 3 panels), 400 μg (middle 3) and 600 μg (bottom 3) total protein loaded for polypeptide spot 8 of MW 76,100, pI 8.1. Bottom: Plot of protein spot integrated density above background versus total protein loaded (200 μg, 400 μg and 600 μg) for the same spot.
Full results from the LF Validation experiment are provided in the PowerPoint presentation. Not all of the 60 spots showed good linearity (R2 value > 0.997). However, with one exception, all instances of high error could be easily explained by splitting problems or insufficient staining at the lowest load because of low abundance.
Summary: The average coefficient of variation (CV)* for spot volume measurements =10%; average CV* for spot % = 15%; Average R2 value** for “spot volume vs μg loaded” plots = 0.9874. Spots with high error can be explained (low abundance proteins, splitting problems) with one exception which we theorize is due to protein aggregation. Our large format, 2D SDS PAGE gel system resolves protein mixtures reproducibly and quantitatively for samples prepared with 2.5% SDS plus 4.5 M urea.
*n = 540 polypeptide spots; **n = 60 plots
Effect of increasing protein load (without overloading) on spot resolution.
Figure 2. The spot pattern obtained when increasing amounts of actin including alpha, beta and gamma spots are subjected to 2D electrophoresis with Coomassie blue staining. Heavy loading with 5-10 μg of actin does not cause streaking but rather the spots become larger and more rounded. In general, molecular weight should be measured from a horizontal line drawn through the upper extremes of a spot. Note however, when proteins are very heavily overloaded, artificial spot splitting occurs and resolution of nearby proteins is affected.


