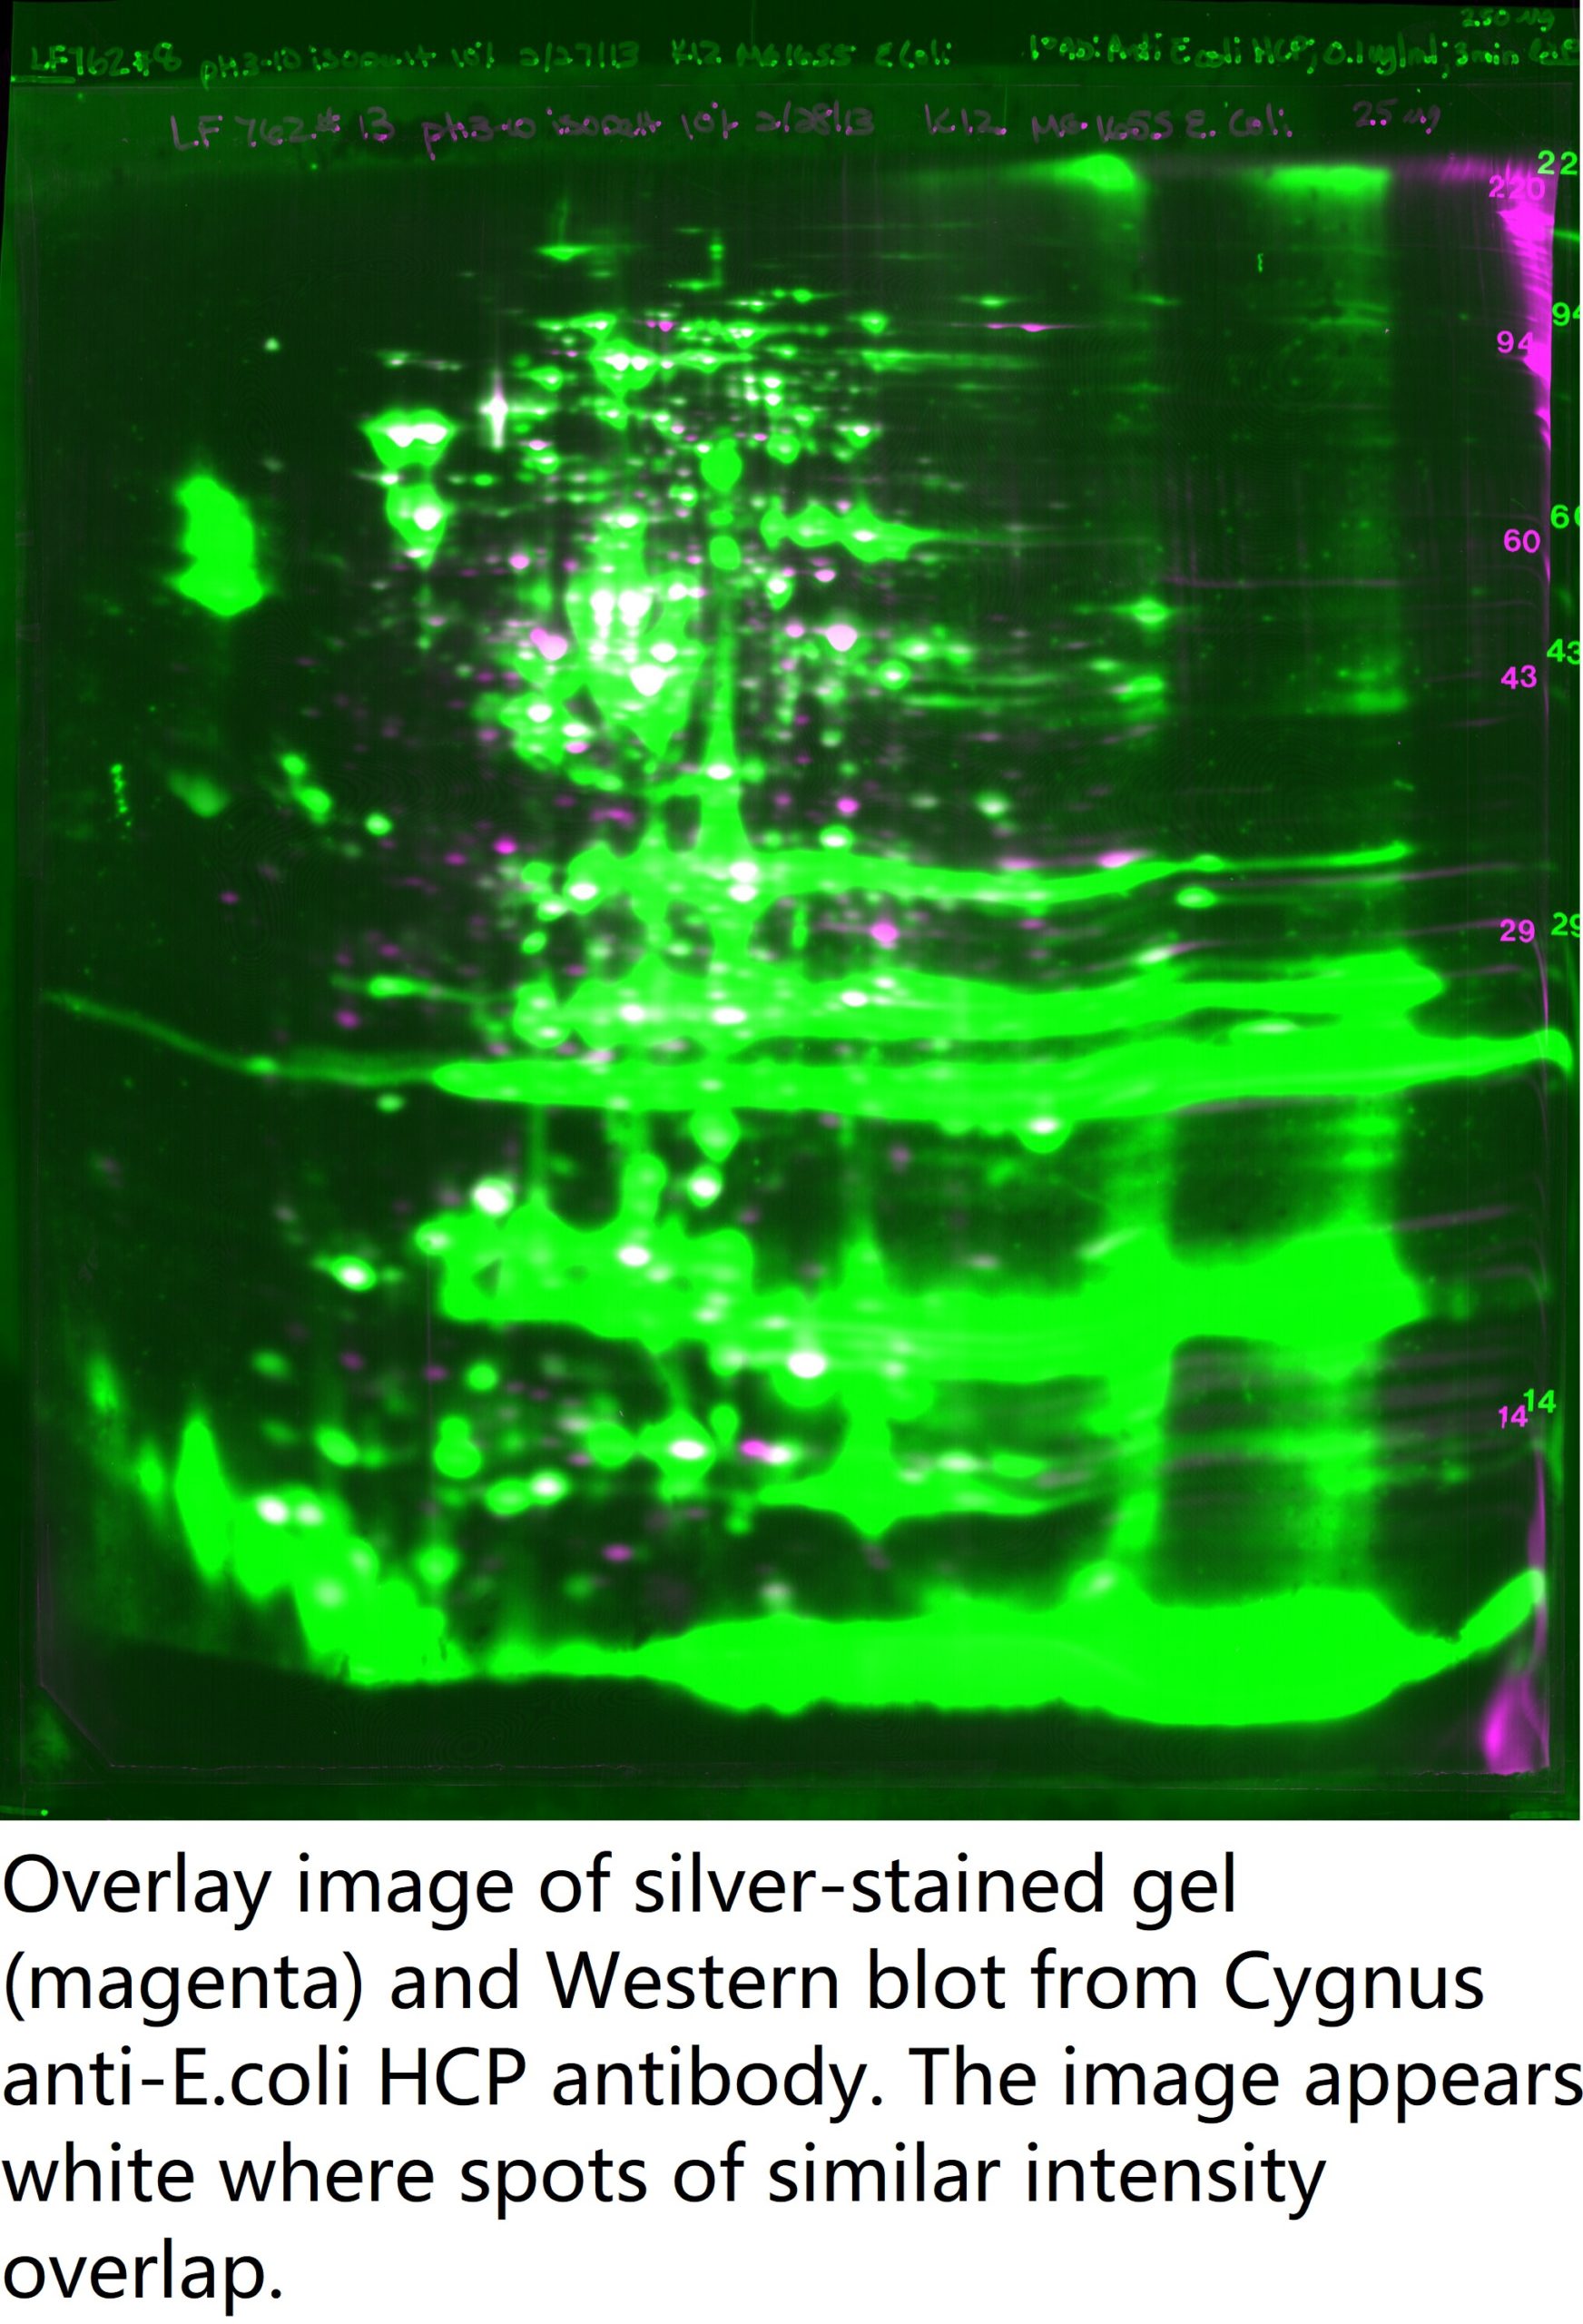
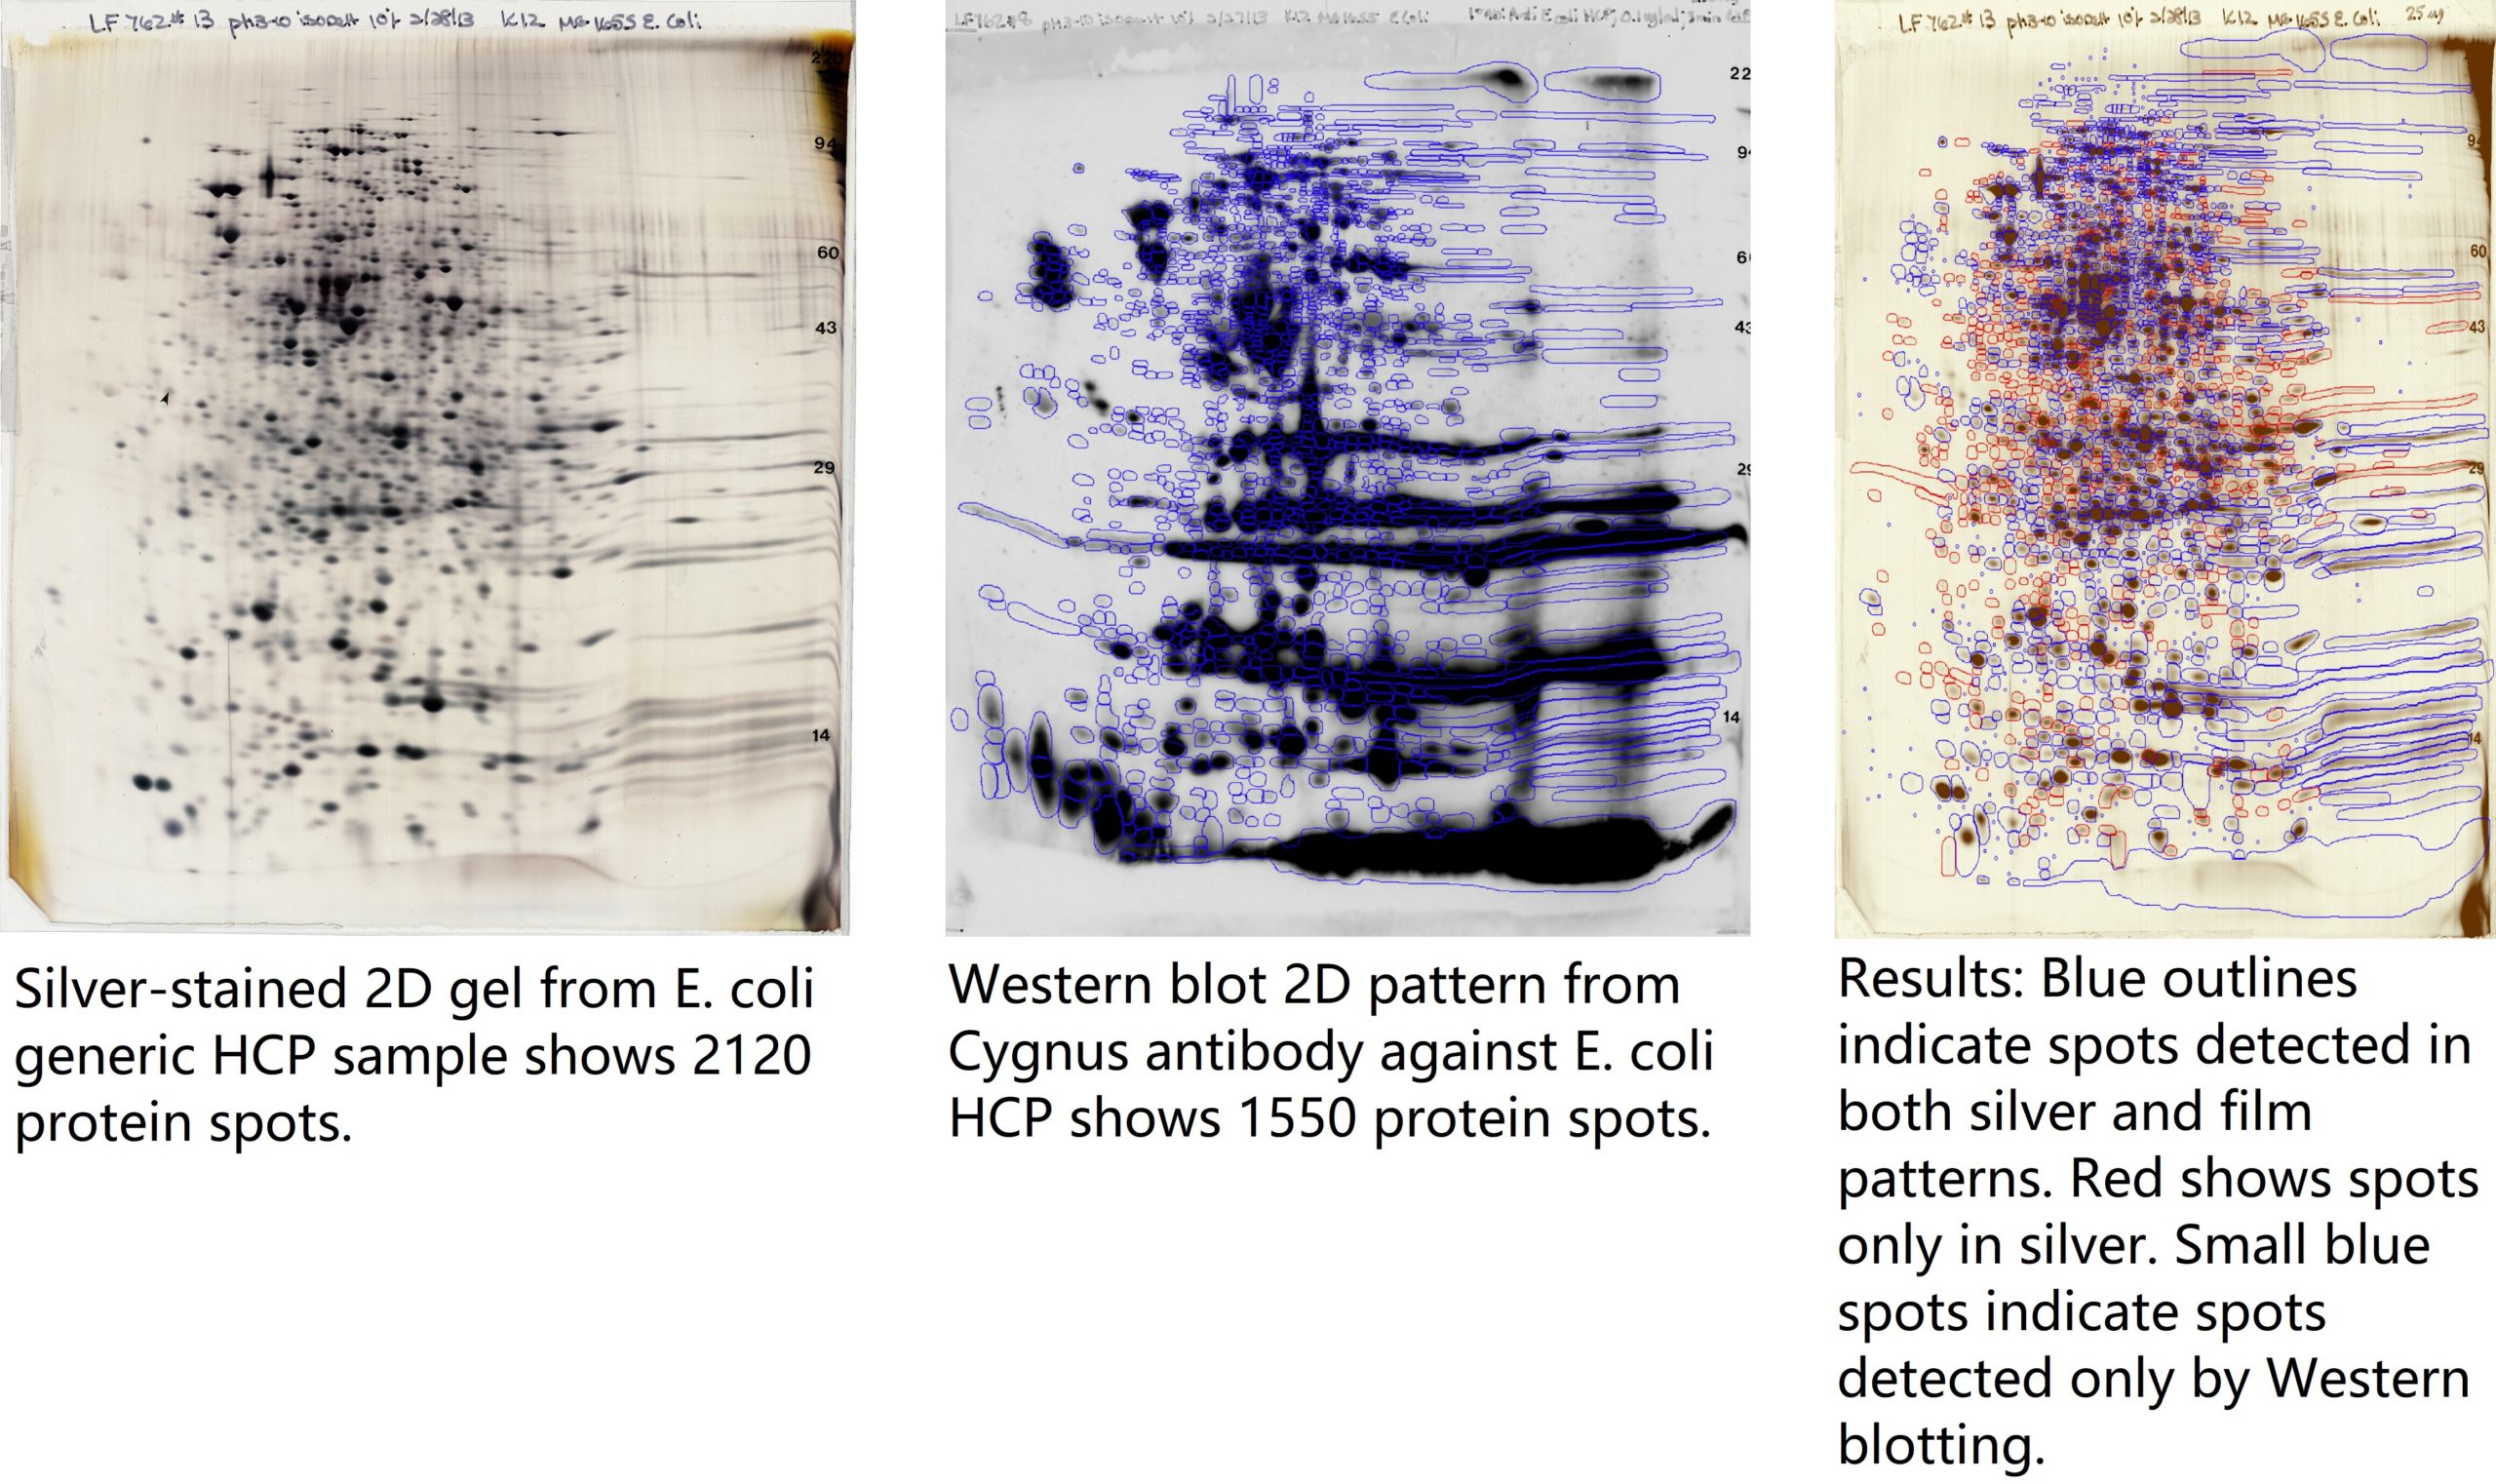
Reports are generated for each 2D HCP analysis antibody coverage analysis. The reports include a table showing volume data for all spots and images of gels, films, and spot circling. Examples of images from an anti-E. coli HCP analysis are provided below and a full example Report (PDF) is linked. If a different report is desired, custom report writing is offered for an additional fee. Also included with the report is a Letter (PDF) that summarizes the coverage of the antibody. If requested, optional Run documentation and tracking (PDF) information is included at the end of the final report.


Example Final Results:
1550 spots were detected by the anti-E. coli HCP antibody out of a total 2120 spots. The resulting antibody coverage is 73% (1550/2120). The total spot count is the summation of spots that are present on the silver stained gel and those that are detected by the western blot, but not visible on the silver stained gel. Specific spots of interest may be identified by mass spectrometry. See the Western-Silver Alignment PPT for computer analysis details.
Method Reproducibility:
This complex assay is has been standardized at Kendrick Labs. SOPs are in place for each step; Biochemists and 2D Analysts are rigorously trained. Client confidentiality precludes discussion of results, but we can say in two instances, HCP antibody analyses were performed in triplicate on the same sample, i.e. 1 run/day on 3 different days, with each run analyzed by a different 2D Analyst. In one case the Coefficient of Variation (SD/Mean*100, n = 3) for the % coverage result was 8.1%; in the other, the CV was 5.1%