How does the service work?
Does 2D Western blotting work as well as 1D?
Yes, 2D works better because the proteins clumped together in a 1D band are further spread out in 2DE by isoelectric focusing. 2D WB is extremely sensitive and informative. The method has been optimized and standardized at Kendrick Labs. Each PVDF blot is stained with Coomassie blue and scanned with a desktop scanner before immunostaining to allow us to check the protein pattern. Coomassie staining of the blot does not interfere with WB. It allows us to determine that the internal standard has transferred well and that the pattern looks reasonable. (Free repeats are performed if problems should arise.)
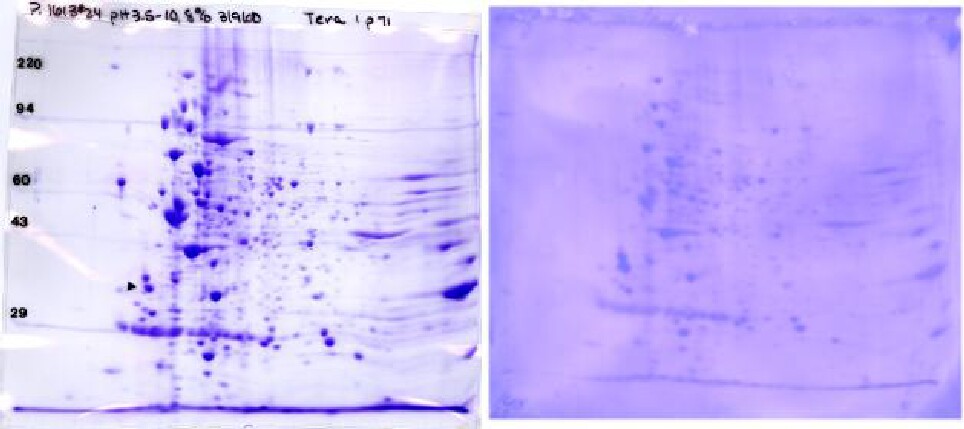
The Figure below shows a Coomassie blue-stained 2D gel and corresponding Coomassie blue-stained PVDF blot. We can send the stained PVDF sheet to you for immunostaining in your lab, or do it here if you send the antibody. The PVDF pattern is muted, but major proteins and considerable detail are still discernible. This allows matching between the duplicate Coomassie stained gel and the Western blot pattern. The stain on the PVDF disappears during subsequent treatments, but the ECL film pattern is super imposable with the image of the stained PVDF. This allows the film pattern to be exactly matched to the Coomassie blue-stained PVDF pattern and from there to a duplicate Coomassie gel for spot cutout for mass spectrometry.
Coomassie blue-stained 2D gel (~300 μg, left) and PVDF blot (~100 μg, right) of Eukaryotic cell line Tera I. Conditions: pH 3.5-10 ampholines, 8% acrylamide slab gels. Presented with permission of Dr. Bonnie King, Yale University School of Medicine, New Haven, CT.
What is the sensitivity of your stains?
Every protein stains differently so it’s difficult to say exactly. Our in-house Coomassie blue stain is very sensitive, gives a fairly dark tropomyosin spot at 0.5 μg and a clearly discernible one at 100 ng. We find it’s roughly equal in sensitivity to the fluorescent stain Sypro Ruby.
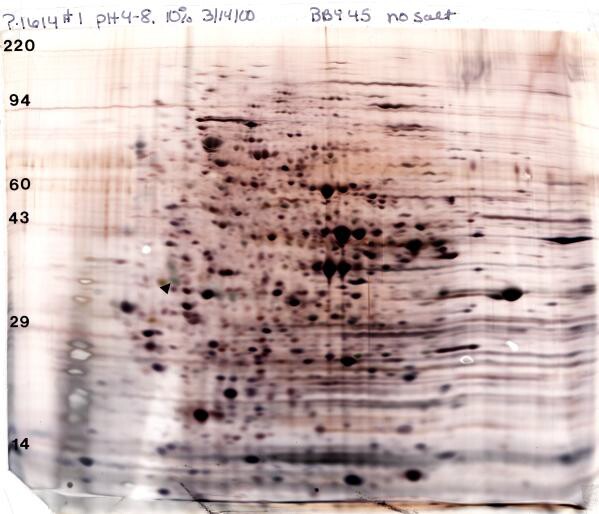
Our silver stain rocks! For silver staining we use a glutaraldehyde prefix that increases sensitivity and typically gives a reasonable spot at 25 ng and a discernible spot at 1-10 ng depending on the protein. Because of the high sensitivity, the total protein loaded for silver staining is usually kept to 50 μg for complex mixtures for Standard Format (SF, 13 x 15cm) and 100 μg for Large Format (LF, 20 x 22 cm) gels. Even given the reduced load, silver staining is about ten times more sensitive than Coomassie staining. The figure (below) shows a silver-stained Standard 2D gel loaded with 50 μg of yeast lysate. Note: for mass spectrometry our “special” silver stain (STP-3) without the glutaraldehyde fix must be used.
Silver-stained 2D Gel electrophoresis pattern of 50 μg yeast prepared according to our standard protocol with the addition of phosphatase inhibitors. Conditions: pH 4-8 ampholines, 10% acrylamide slab gel with silver stain. The arrow indicates our internal standard loaded at 50 ng. Shown with permission of Dr. Irene Ota and Dr. Anne Burkholder, University of Colorado, Boulder, CO.
What is the maximum amount of protein and volume that can be loaded on a 2D gel?
In general for complex samples such as cell lysates run on SF gels, we suggest a maximum load of 200 μg for Coomassie blue or Sypro ruby staining and 50 μg for silver staining. Protein concentrations for complex samples such as cell lysates should be about 5 mg/ml for Coomassie blue and 1 mg/ml for silver staining since the maximum volume that can be loaded is 50 μl. For LF gels we suggest a maximum load of 300-800 μg protein for complex samples for Coomassie blue and Sypro ruby staining and 100 μg for silver staining. The maximum volume that can be loaded is 150 μl.
The figure (below) shows the 2D spot pattern of increasing amounts of purified actin. Heavy loading with 5-10 μg of actin does not cause streaking, but rather the spots become larger and more rounded. This only holds true up to a point however; 50 μg of a single protein (serum albumin for example) streaks severely and also changes the pH gradient.
Spot pattern obtained when increasing amounts of actin are subjected to 2D electrophoresis with Coomassie blue staining. A line from the molecular weight standard actin added to the agarose sealing the tube gel to the slab gel runs through the top of each spot. In general, molecular weight should be measured from a horizontal line drawn through the upper extremes of a spot.
How are pI and MW standardized?
Molecular weight (MW) markers listed below are loaded in a well on the right side (basic side) of the 2D gel in a well in the agarose that seals the tube gel to the slab gel. A single isoelectric focusing standard, tropomyosin of pI 5.2 and MW 33,000, is added to every sample as a control and is marked by an arrow on the gel. This internal standard allows alignment of the gel with a pH gradient plot created for each set of ampholines. (See question “How can I determine the isoelectric point of my protein of interest?)

How can I determine the isoelectric point of my protein of interest?
A pH gradient plot obtained with a surface pH electrode and six IEF tube gels (run with buffer only) is returned with every set of gels to aid in determining pI’s of specific proteins. This plot can be used to find the pI of your protein of interest.
First, you must match the pH gradient plot to the final 2D slab gel. The exact size of the slab gel varies with treatment; enhanced gels are larger, silver-stained gels a bit smaller than Coomassie blue-stained gels.
Simply adjust the size of the pH gradient plot on a photocopier so that it fits your gel. Then overlay the printed plot on the gel on a light box, line up the tropomyosin standard to the proper pI of 5.2, and read your protein’s pI off the plot. We can do this for you.
It’s often useful to cover the gel or film with a transparent overlay sheet cut to size so that you can write on it with a sharpie. Tape on one side with scotch tape.
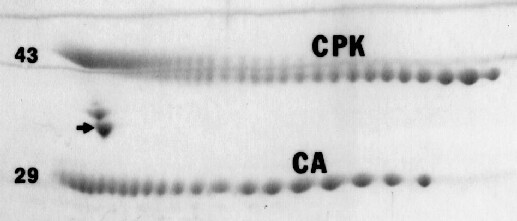
In some cases, salts and buffers in samples may enter the focusing gel and change the pH gradient. When necessary, the carbamylated protein sets of carbonic anhydrase (CA) or creatine phosphokinase (CPK) shown in the figure below may be added to samples to exactly determine a protein’s pI. Radiolabeled carbamylated CA is also available. Note that the isoelectric point of a protein is not a constant value like molecular weight but is dependent on conditions such as pH, buffers and temperature. Our pH gradient plots are for conditions of 9M urea and 22o C.
Example of carbamylated CA and CPK pI markers. The arrow indicates our internal standard tropomyosin added to every sample unless otherwise requested; numbers to the left show MW in thousands.
How are 2D spots of interest identified?
Protein identification is typically achieved using mass spectrometry (LC/MS/MS). Any polypeptide spot, however faint, on a Coomassie blue-stained gel is in range for identification by mass spectrometry. Proteins on a “special” silver-stained gel (STP-3 in Guide to Services) are also identifiable, although silver staining is inhibitory for some proteins.
We don’t carry out mass spectrometry in house, but we have considerable experience in submitting samples to university core facilities. We are happy to handle all aspects of submission of your protein spots including spot cutout, express mailing to the core facility and invoicing. Our default core is Clarkson University Proteomics Lab in upstate New York. Spot cutout is based on your emailed image from a computer comparison, or other communication with our Lab Manager, Jon Johansen. After spot cutout, the dried gels are returned to clients along with a copy of the letter sent to the facility. Turnaround for results is usually 2-3 weeks.
Do you accept radiolabeled proteins?
No. As of December 1, 2017 we will no longer accept radioactive samples.


