COMPUTERIZED COMPARISONS OF 2D GEL PATTERNS FOR DIFFERENCES (2D-ES-10). This analysis includes laser scanning and computerized analysis with Progenesis software (SameSpots and PG240) from Totallab Ltd, UK. Requires prior 2D electrophoresis but free duplicate gels are run and analyzed to confirm differences for samples scheduled for computerized comparisons. Generally 400-800 spots are quantified per Standard Format gel; 800-1500 spots are quantified per Large Format gel. Spot density values are expressed as spot percentages (individual spot density as a percentage of total density in all spots analyzed) to normalize for differences in sample loading or staining. Results are presented in a complete report including images of differences (including montage images for each differing spot), a summary table (spot number, pI, MW, ratios/fold difference, and p values as a second measure of difference), methods and pH gradient plot. A CD containing data and image files is included in the package. Note that our reports focus on protein differences between samples. Picking protein spots later for identification by mass spectrometry is straightforward. Just send us a list of spot numbers and we’ll take it from there. Link to pricing information.
What is included in our 2D gel written report and what is on the CD? We don’t include all the spot data in the written reports because it makes them difficult to read. For example, spot numbers become so numerous that they obscure spot outlines on the figures. However, data for all polypeptide spots analyzed, including unchanging ones, is always included in an Excel table on the CD. The standard written report consists of a cover page and a table showing the spot #, isoelectric point, molecular weight, spot % (spot density above background as a percent of all spots measured), fold difference values, and p values for the differences for changing protein spots. The table is followed by figures of gel images showing the spot positions and spot montage images for each changing spot. The montage images show closeup views of spot shape and outline for every gel in the comparison. In addition to clearly showing significant changes between 2D gel patterns, our reports allow us to easily find the proteins for subsequent spot cutting for mass spectrometry. The CD contains: the report file, images of all gels (tif, jpg), as well as an Excel file giving all spot data. Report Example (PDF) (with permission of Dr. William Shafer, Emory University).
How does SameSpots software work? The 2D gel images are first aligned to exactly match using an alignment module of the software. The analyst then chooses an image as reference for automatic alignment and inserts localized seed matches at various points for each pair. The computer screen, shown below, provides four views of the zoomed matched area that help the analyst decide when the image alignments are perfect.
Figure 1. SameSpots computer screen during alignment of 2D gel images.
Next, the aligned images are imported into the PG240 module of the software where polypeptide spots are carefully hand outlined on a single reference image. Identical spot outlines are then propagated to all the images. The analyst goes through each image and checks to make sure the outlines are accurately placed and outline additional spots if necessary. They go back and realign areas and redraw outlines as necessary. The alignment step is much less time-consuming than correcting spot outlines on every image. Every spot is identical on every gel facilitating statistical analyses such as Anova and Student’s t-test. Once the analysis is complete, a report is generated and then checked by QA personnel before going out to the client.
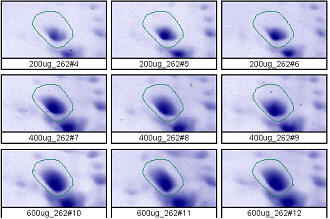
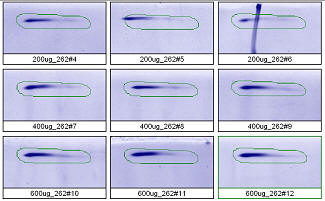
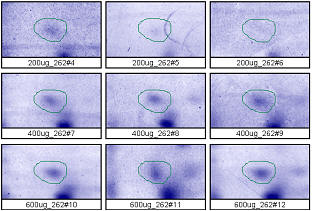
Examples from SameSpots: Figures 2-4 show expanded results for three polypeptide spots (Fig. 2 spot, MW 60,800; Fig. 3 spot, MW 300,000; and Fig. 4 spot, MW 14,800) from 2D gel images analyzed by Progenesis software. To obtain these figures, the same test sample (rat liver cytosol dissolved in SDS buffer) was run in triplicate at 200, 400 and 600 μg loads on nine large format 2D gels according to standard procedures. The Coomassie-stained gels were scanned with a calibrated laser densitometer; 60 polypeptide spots on every image were analyzed by Progenesis software after manual outlining of a single image. See our Method Validation PowerPoint for a complete report including the 60 spots.
The three examples (Figures 2-4) are laid out to show spot outlines in montage view (top) along with plots of spot volume vs ug loaded (bottom). Note that results for clients are usually reported in spot percentages (spot density taken as a percentage of the total density of all spots analyzed) because it corrects for any differences in loading and staining. The plots of spot volume versus ug protein loaded give straight lines (R2= 0.9946, 0.9758, and 0.9735), confirming that the multi-step procedures of 2D electrophoresis and Coomassie blue staining give quantitative results.

Figure 2. Progenesis analysis results for a dark polypeptide spot of MW 60,800, pl 5.4. The left image shows spot outlines in montage view of 9 gels loaded with 200, 400 and 600 μg protein in triplicate. The right image shows a plot of average spot integrated density above background versus μg loaded on gel.

Figure 3. Progenesis analysis results for a high molecular weight polypeptide spot 300,000, pl 5.7. The left image shows spot outlines in montage view of 9 gels loaded with 200, 400 and 600 μg protein in triplicate. The right image shows a plot of average spot integrated density above background versus μg loaded on gel.

Figure 4. Progenesis analysis results for a faint polypeptide spot of MW 14,800, pl 5.7. The left image shows spot outlines in montage view on 9 gels loaded with 200, 400 and 600 μg protein in triplicate. The right image shows a plot of average spot integrated density above background versus μg loaded on gel.
Progenesis Cutoff for Differences: To reiterate, for Progenesis software, spot outlines are carefully hand outlined on a single reference image and spots are propagated to all images. Images are checked for alignment and outline accuracy (corrected if needed), and additional spots are outlined if needed. Statistical analysis generated by Progenesis is used to find protein spot differences between samples. Typically, spot fold change values of ≥ 3 and ≥ 1.7 fold change with a p value ≤ 0.05 are reported in the table. Custom criteria for fold changes and p values is determined from your data to find the top 10% of changing spots. All spot data is included in an Excel file on the CD. Custom analysis and criteria is available to meet your needs.


