Overview
Food & Nutritional Protein Analysis
Clients from the food, dairy, supplement, personal care, and other industries rely on Kendrick Labs’ 1D gel electrophoresis testing service to analyze proteins in their products.
We offer two methods for quantification of proteins resolved by 1D: Relative Dye Binding or Percentage by Weight. Either method can be used to compare differences between samples; results are expressed in different units.
Relative Dye Binding Protein Quantification: Determine relative amount of proteins present in a sample. Example Relative Dye Binding Report (PDF)
Percentage by Weight Protein Quantification: Determine percentage by weight of an individual protein present in a sample compared to a standard. Example Percentage by Weight Report (PDF)
We can also do:
Molecular Weight Distribution: Determine the size (molecular weight) of proteins present in your sample. Example MW Distribution Report (PDF)
Custom Analysis: Contact us to discuss your project, and our experts will create a customized plan for you.
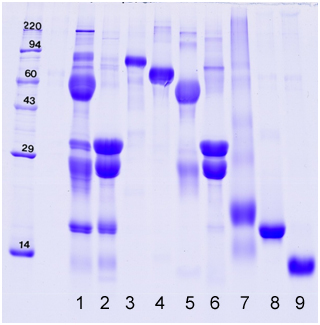
How does 1D gel electrophoresis work? 1D Electrophoresis (aka SDS PAGE) is useful for separating proteins in a mixture by size. Below is an image of a Coomassie blue-stained gel loaded with common food samples to show the different protein banding patterns
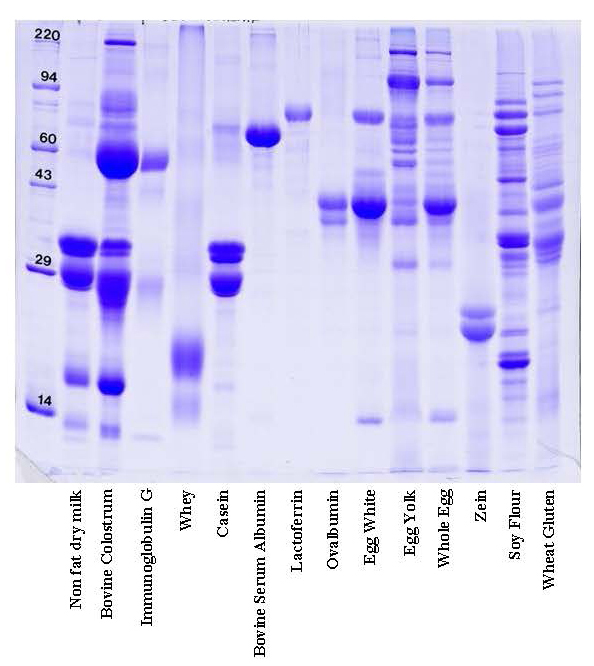
In this method, samples are measured, solubilized and denatured in an SDS-containing buffer, and then separated by size in a gel matrix. Proteins in the gel are stained with Coomassie blue to visualize them. Molecular weight standards allow for calibration of protein size. Proteins can be quantified by determining band percentage (stain density of each protein as a % of total stain density of all proteins in the lane) or percentage by weight of the sample (quantified relative to a standard curve of the protein of interest). In addition, individual bands can be cut out of the gel, and proteins identified by Mass Spectrometry.
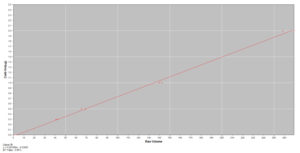
STD Curve
Percentage by Weight Protein Quantification with a Standard Curve
Kendrick Labs can determine the amount of specific proteins in your sample based on quantification using a standard curve of your protein of interest. For example, a standard curve of purified lactoferrin is used to determine the amount of lactoferrin in the unknown whey samples below. Follow the links for pricing or an example report(PDF) for percentage by weight quantification of an individual protein with a standard curve.
The amount of an individual protein in most samples can be determined in this manner if a purified standard is available. If the proteins in the sample are complex, it may not be possible.
Example gel loaded with bovine milk proteins (whole, fractions, and individual pure proteins)
1. Colostrum
2. Non fat dry milk
3. Lactoferrin
4. Bovine Serum Albumin
5. Immunoglobulin G
6. Casein
7. Whey
8. β-Lactoglobulin
9. α-Lactalbumin
Relative Dye Binding
Relative Dye Binding Protein Quantification
Individual proteins in a sample can be measured by the relative amount of Coomassie blue dye that they bind. Proteins vary somewhat in their affinity for Coomassie blue depending on their amino acid sequence, so bound dye is not an absolute measure. When comparing the same protein in different samples with this method, the differences are quantifiable.
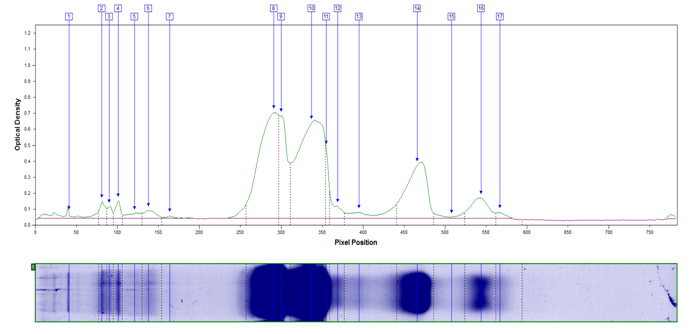
If bands in the sample are known, we identify them in the results table. An example of results from relative quantification of proteins in a nonfat dry milk sample is shown below along with a peak profile graph. Follow these links for pricing or an example report(PDF).
Band/Protein/Percentage
1. unknown 1.73
2. Lactoferrin 1.13
3. unknown 0.65
4. BSA 1.07
5. unknown 0.81
6. IgG 1.15
7. Unknown 1.09
8. α S1Casein 24.05
9. α S2Casein 10.81
10. β Casein 29.99
11. Kappa Casein 2.63
12. Unknown 1.95
13. Unknown 2.73
14. β-Lactoglobulin 14.11
15. Unknown 0.91
16. α-Lactalbumin 4.41
17. Unknown 0.70
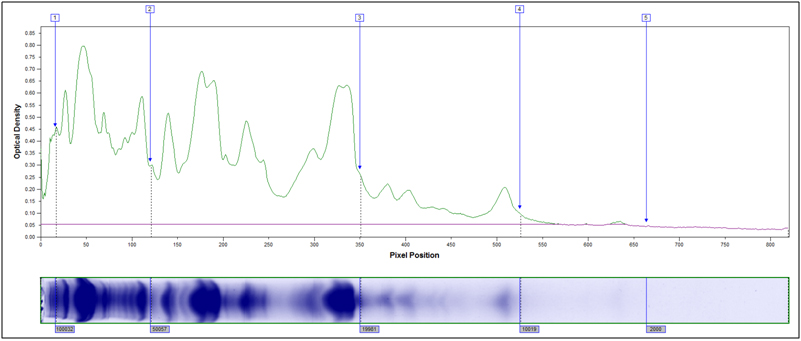
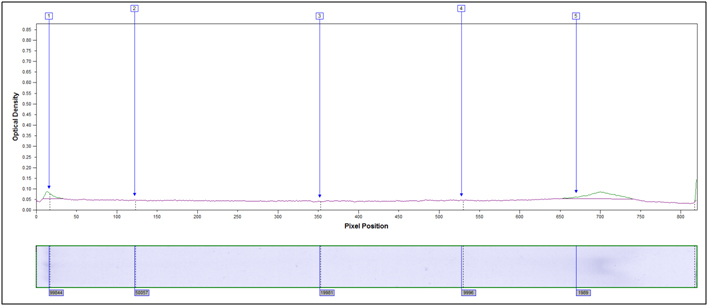
Example peak profile plot for non fat dry milk.
MW Distribution
Molecular Weight Distribution
Molecular weight distribution analysis is useful to show how the different protein components of a sample are distributed according to their molecular weights (MW). This is useful for monitoring intact protein in a sample with different process treatments.
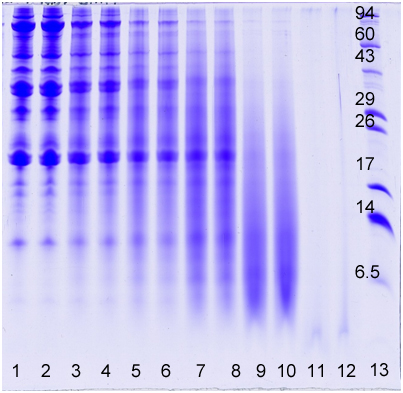
Below is an image of a gel showing different time and temperature treatments of a soy flour sample in 2-4 M HCl. The acid/heat treatment hydrolyzed the soy flour proteins—breaking them down into smaller amino acid fragments. The longer the time and higher the temperature, the less intact protein is present. Molecular weight distribution plots can be used to show changes in the amount of intact protein with treatment.
Follow links for pricing or an example report for Molecular weight Distribution of proteins.
Lane, Treatment/Sample
1-2, No Treatment
3-4, 60°C 5 min, 2 M HCl
5-6, 60°C 10 min, 2 M HCl
7-8, 80°C 5 min, 2 M HCl
9-10, 80°C 10 min, 2M HCl
11-12, 95°C 40 minutes, 4M HCl
13, MW Markers
The following proteins (Sigma Chemical Co., St. Louis, MO) were added as MW markers to lane 13: phosphorylase A (94,000), catalase (60,000), actin (43,000), carbonic anhydrase II (29,000), and lysozyme (14,000). Ultra Low Range Molecular Weight markers (Sigma Chemical Co., St. Louis, MO, Cat# M3546) were also loaded in lane 13: triosephosphate isomerase (26,600), myoglobin (17,000), α-lactalbumin (14,200), pancreatic trypsin inhibitor (6,500), insulin chain B (3,496, not visible on example gel), and bradykinin (1,060, not visible on example gel). These MW markers appear as horizontal bands and are labeled with numbers on the 16.5% acrylamide slab gel (lane 13).
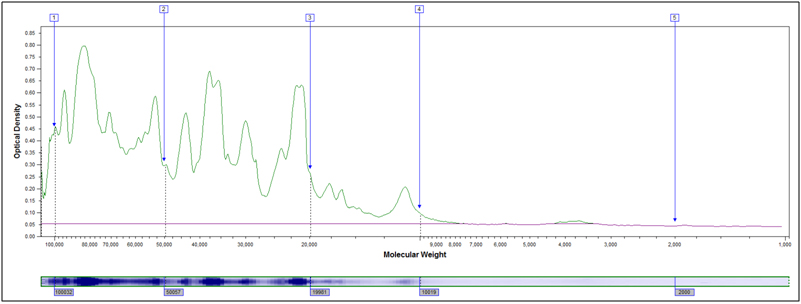
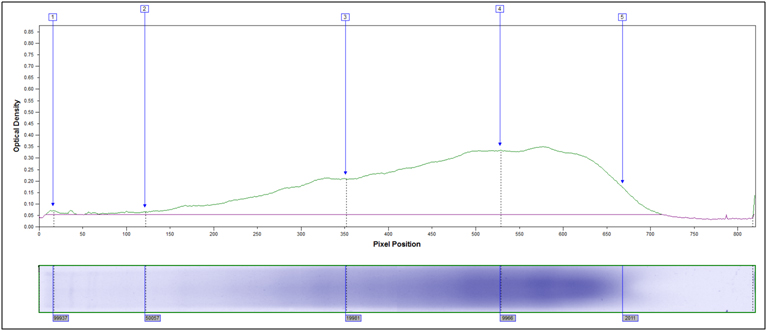
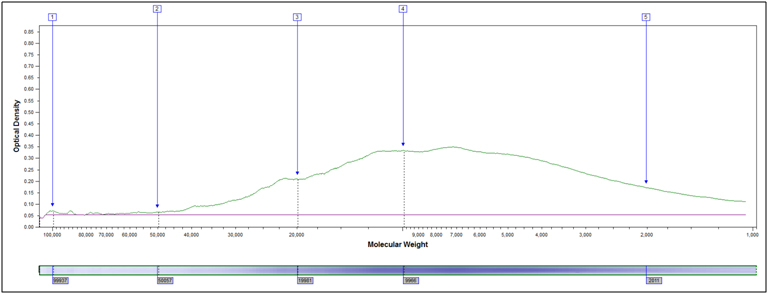
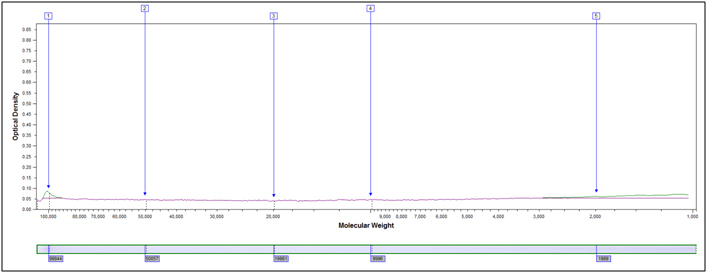
Example peak profiles for the original starting material and two hydrolyzed samples of soy flour are shown below. The x-axis in the peak profile is calibrated for molecular weight, while the y-axis shows Coomassie stain intensity.
Original Starting Material, No Treatment
Partially Hydrolyzed, 80°C 10 min, 2M HCl
Heavily hydrolyzed, 95°C 40 minutes, 4M HCl
Follow links for pricing or an example report for Molecular weight Distribution of proteins.